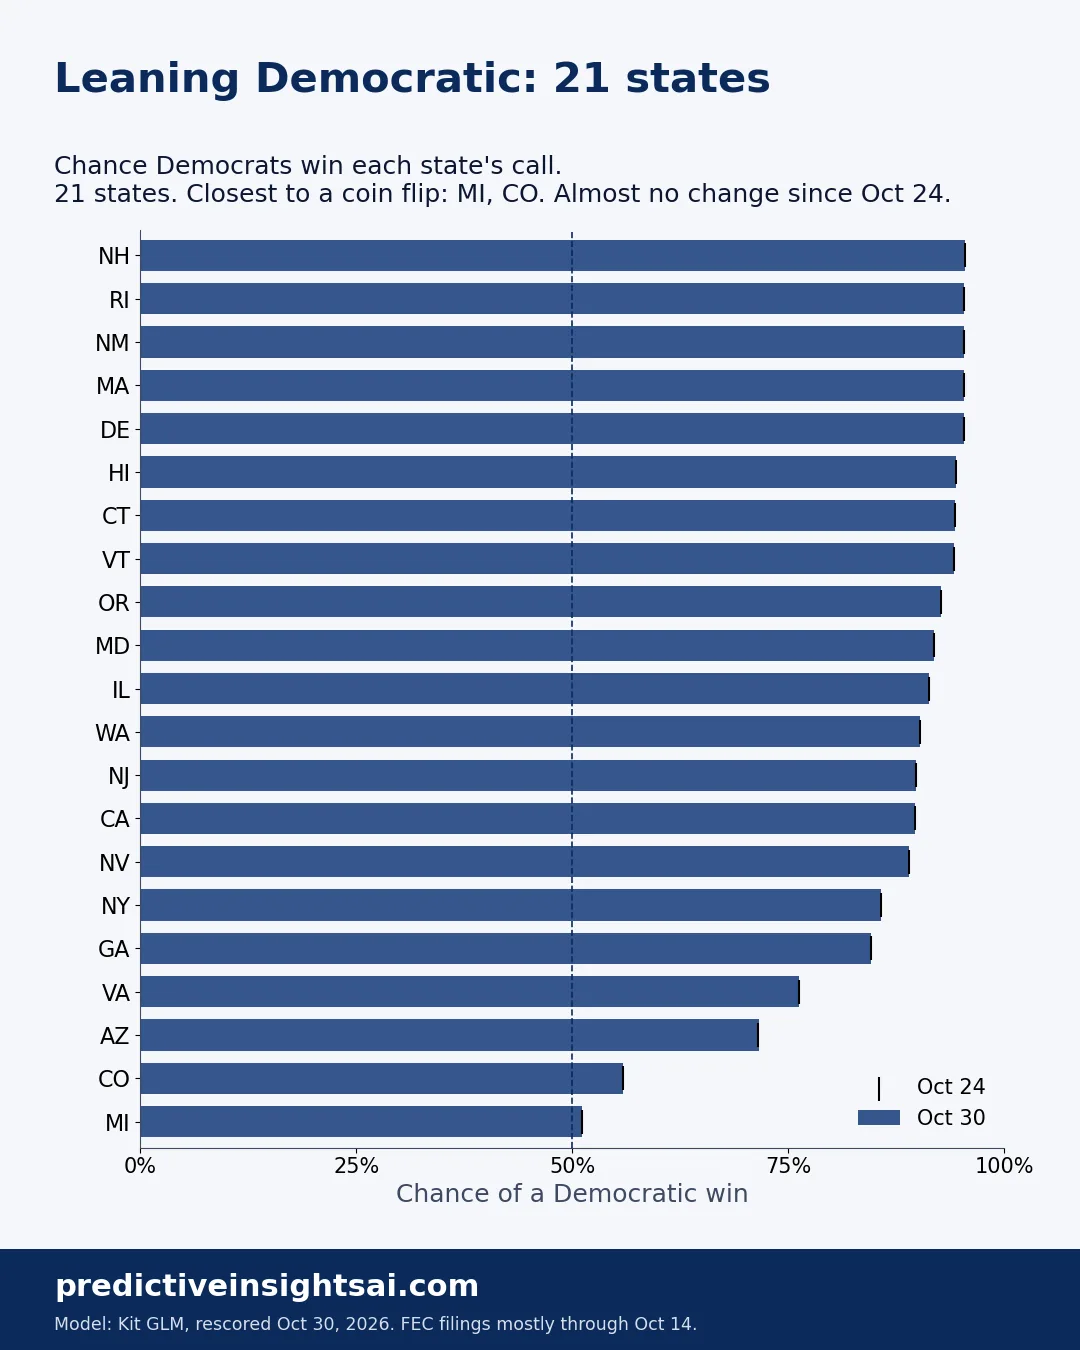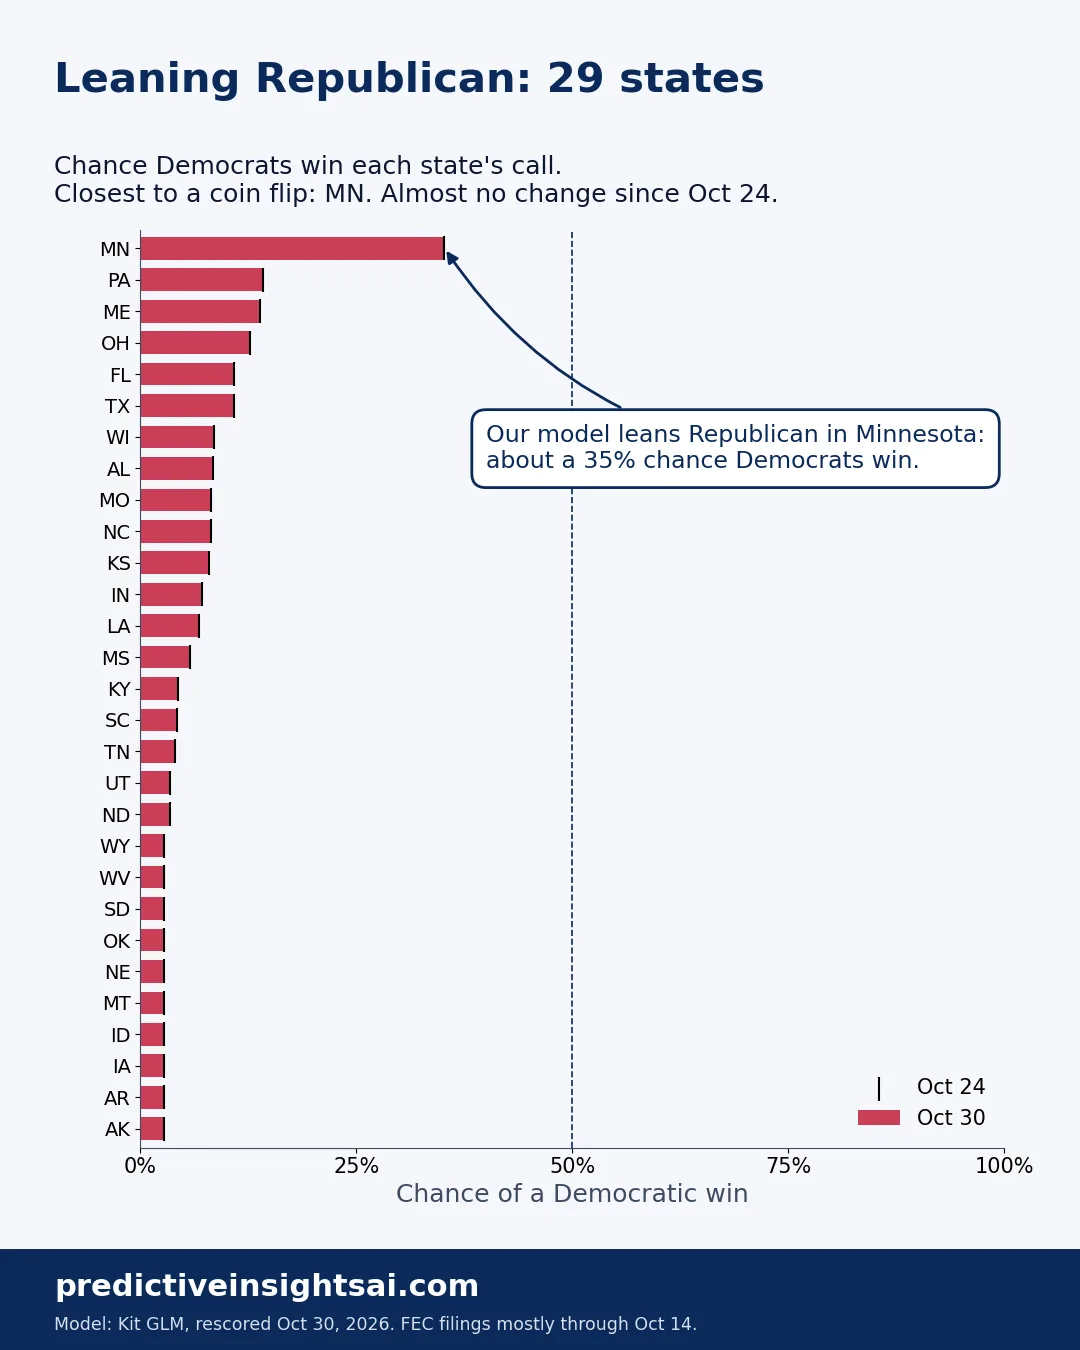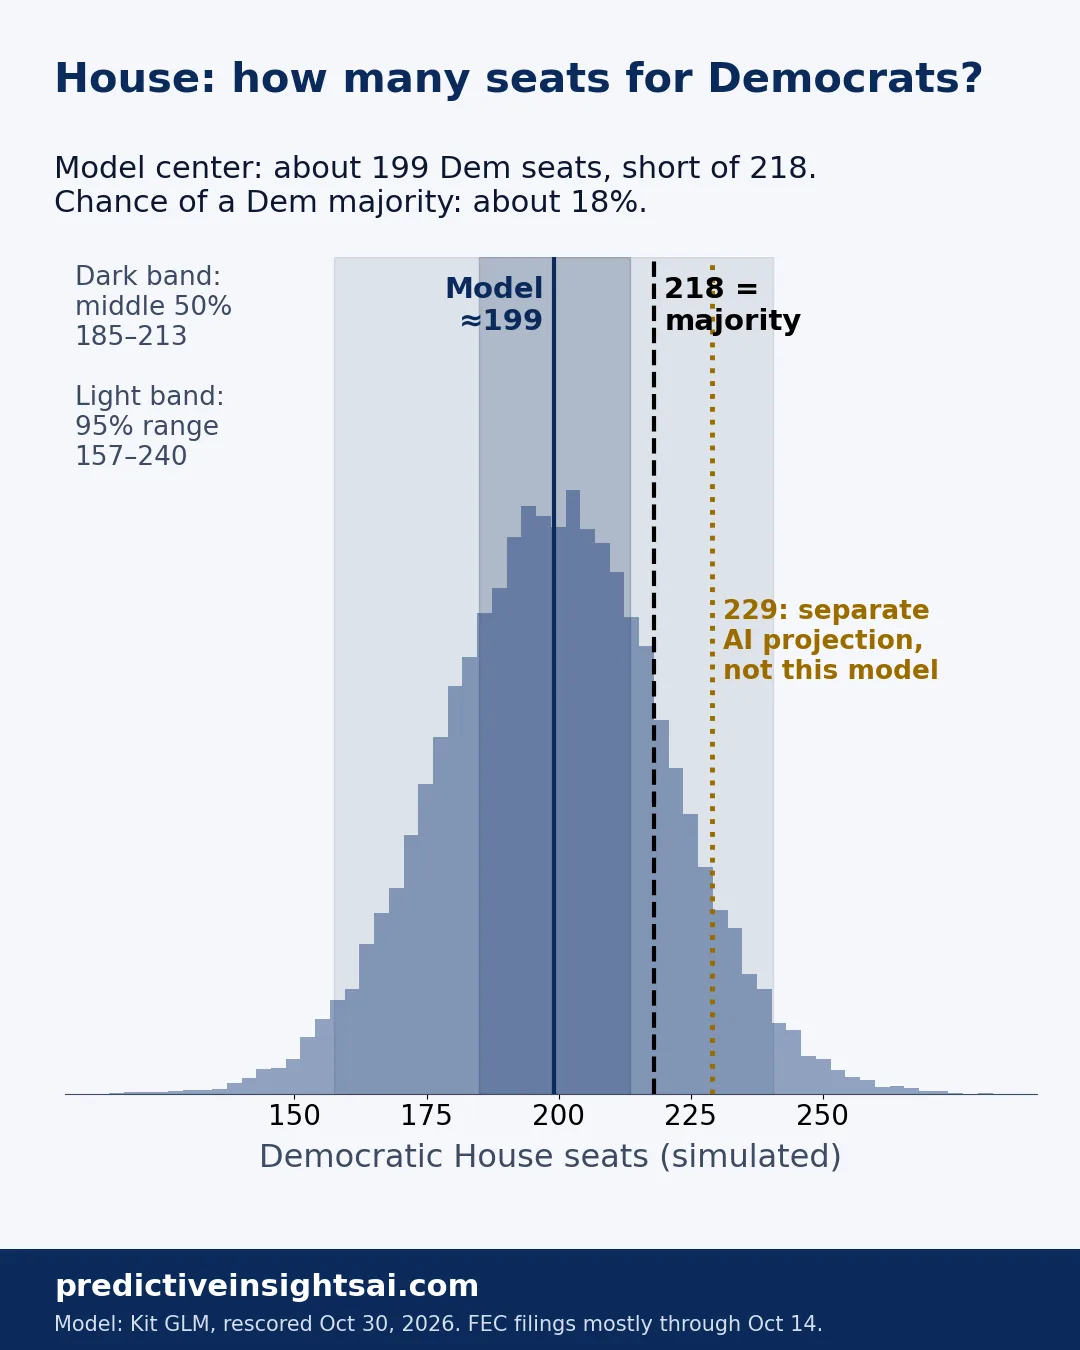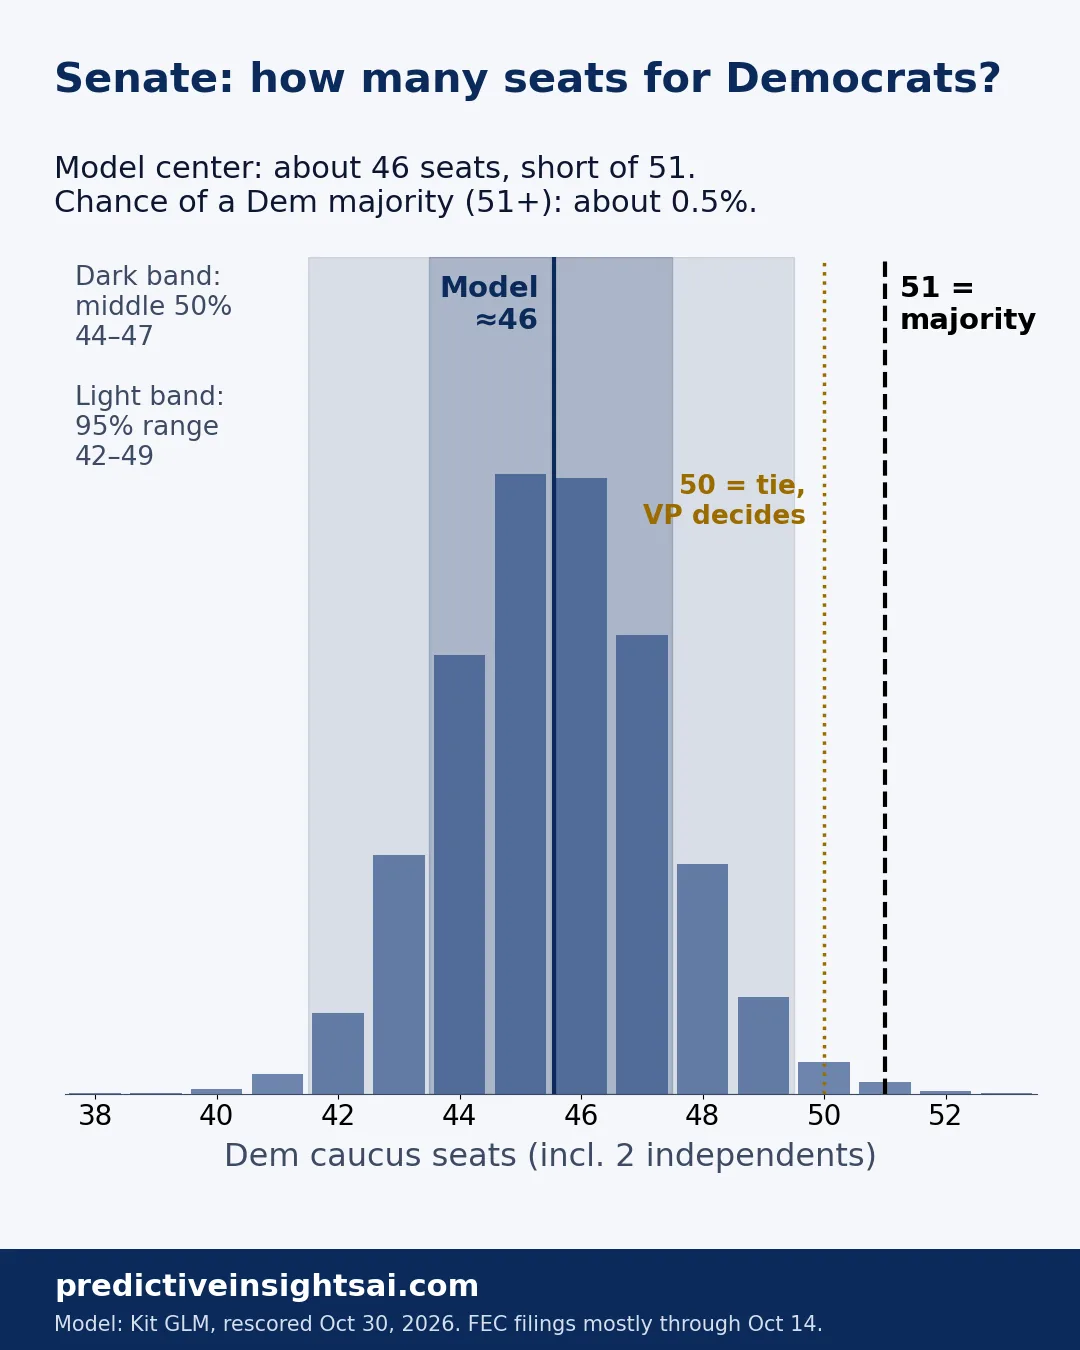


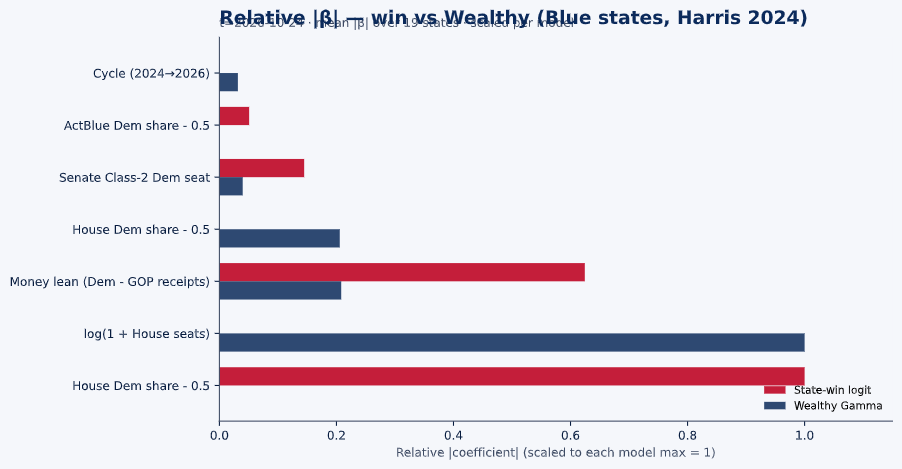
Fifty-state briefing cards
Selected: —
AK — Alaska
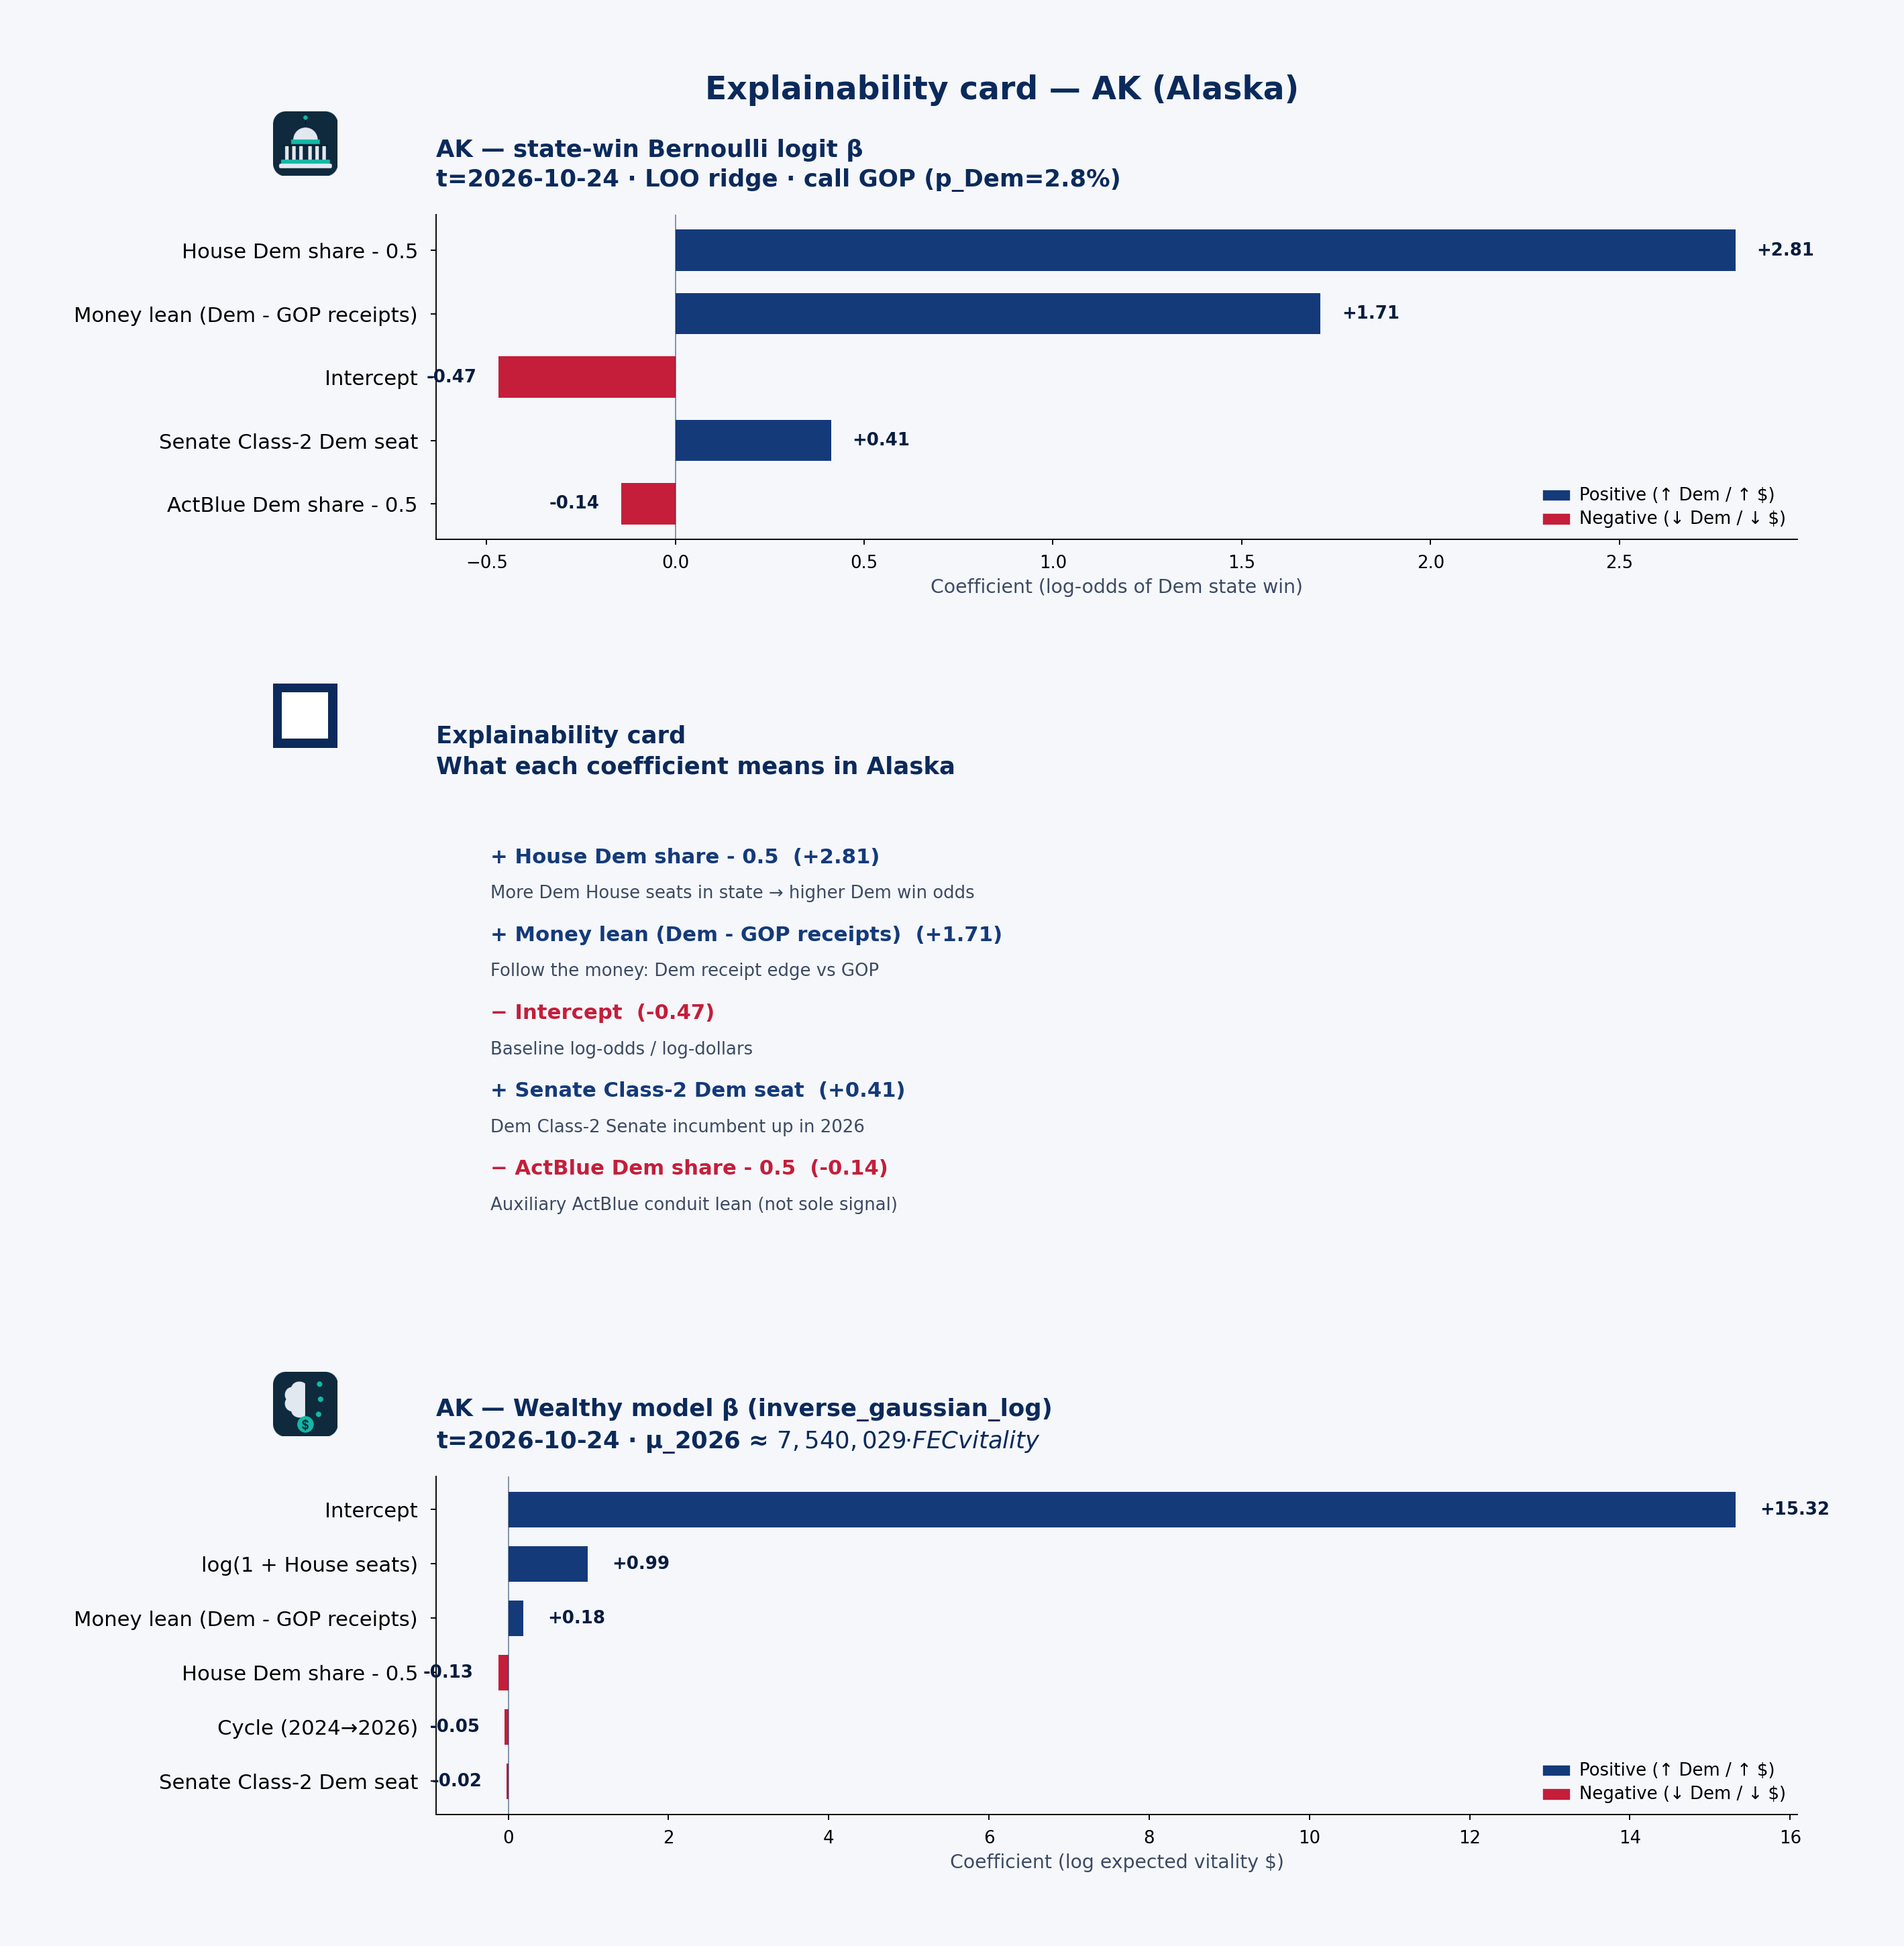
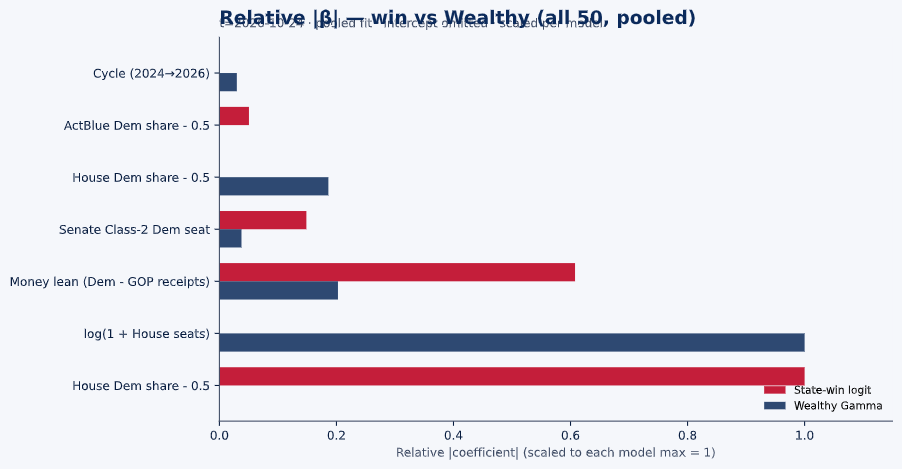
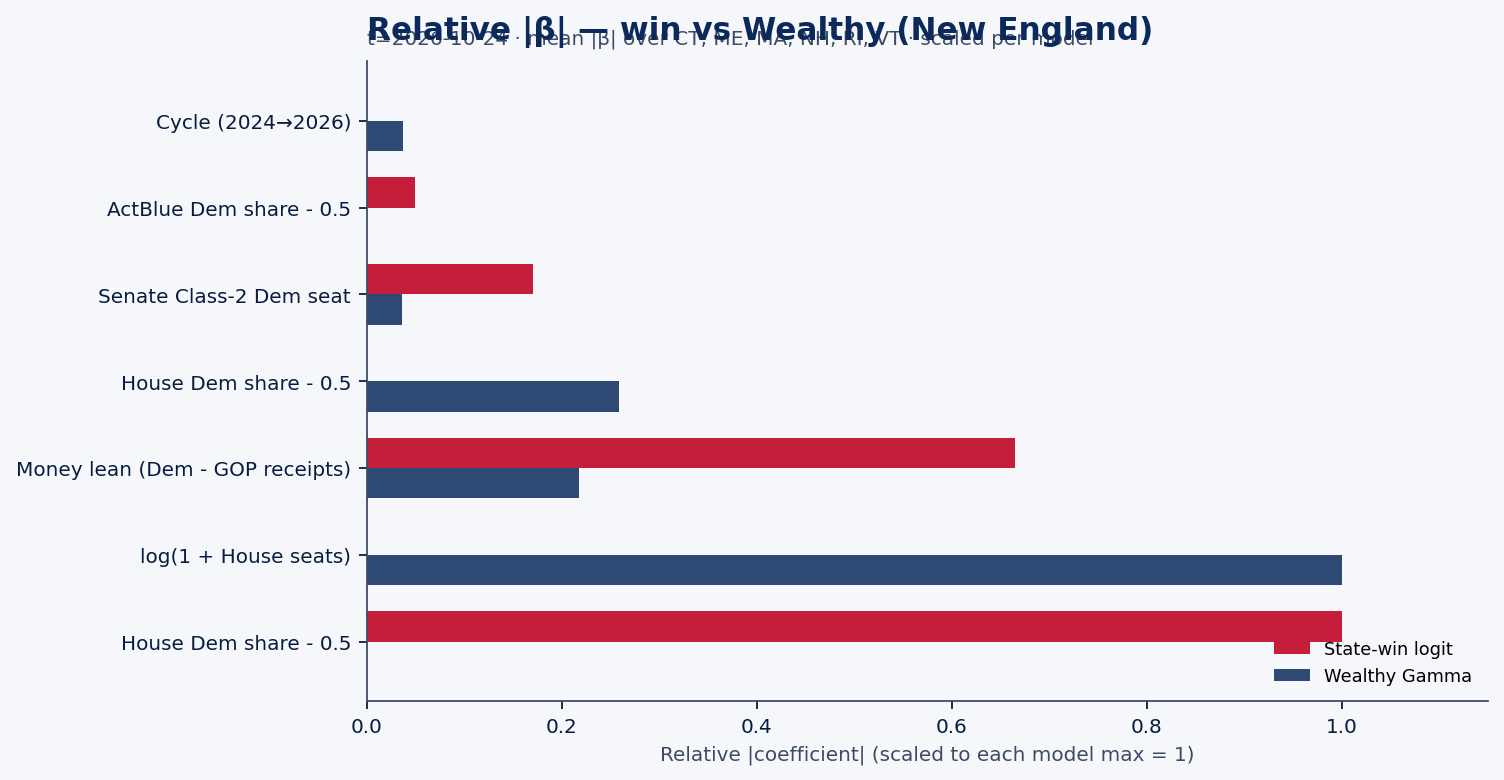
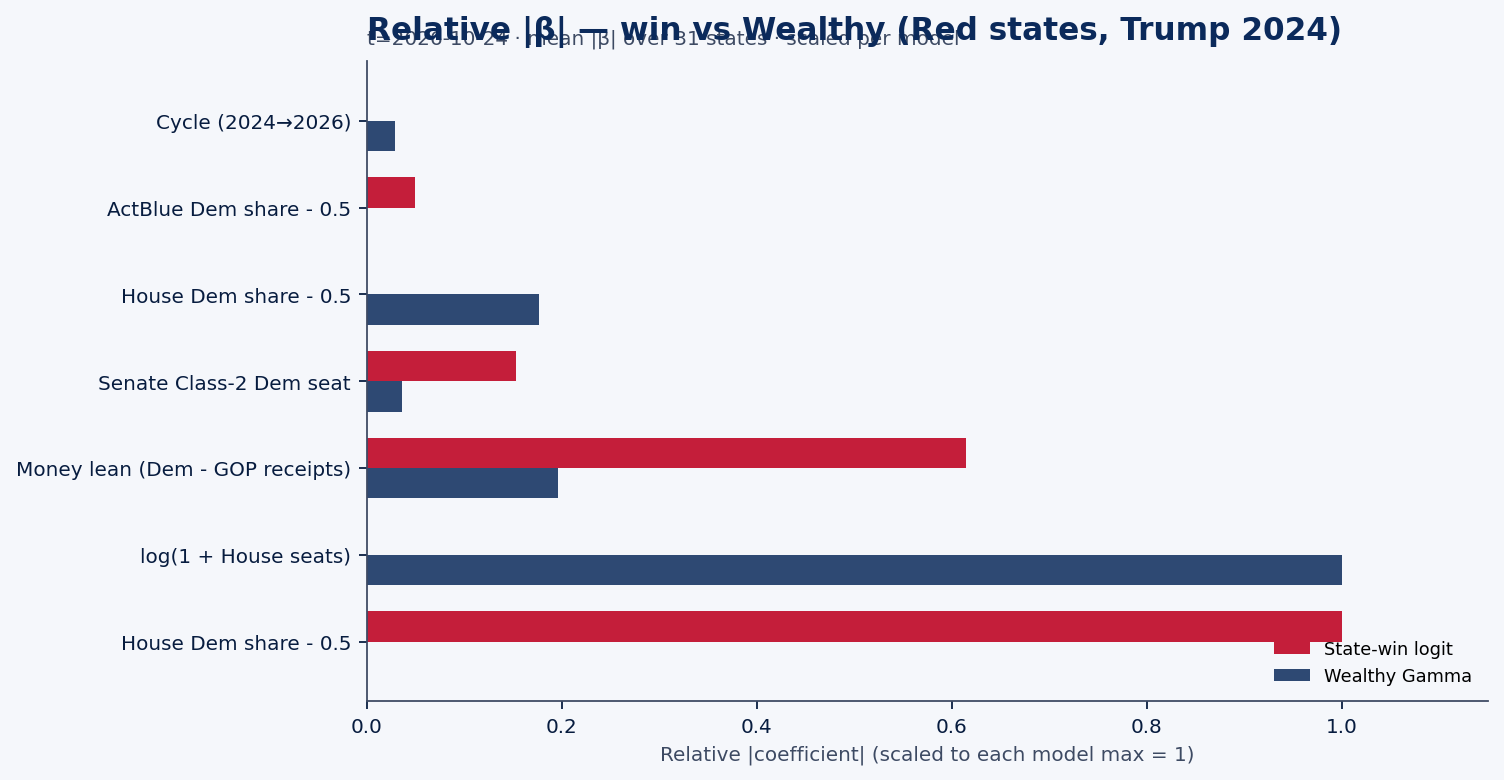
 State explainability card · state-win LOO coefficient stability, plain language, and Wealthy model · AK · t=2026-10-24
 Statewide call: GOP (p_Dem=3%) · 2026 money shape: balanced
 Receipts by cycle (campaign-finance weball)
| Cycle | Candidate | Total receipts | Individual | PAC (other pol. cmte) |
|---|---|---|---|---|
| 2024 | BEGICH, NICHOLAS III | $2.81M | $2.31M | $319k |
| 2026 | BEGICH, NICHOLAS III | $6.44M | $3.31M | $1.24M |
| 2024 | MURKOWSKI, LISA | $689k | $356k | $277k |
| 2026 | MURKOWSKI, LISA | $1.38M | $939k | $377k |
| 2024 | SULLIVAN, DAN | $1.89M | $915k | $524k |
| 2026 | SULLIVAN, DAN | $11.51M | $5.71M | $2.28M |
 PAC & individual money
PAC money was about $1.12M of $5.39M total receipts in 2024 and $3.90M of $19.33M in 2026. Direct committee→candidate 24K (non-memo) ran about $1.21M (2024) / $3.83M (2026). Itemized individual share from Alaska: 66.4% (2024) / 51.5% (2026).
SULLIVAN, DAN: Cycle-to-date weball receipts ~$11.51M, with PAC direct 24K $525k → $2.30M vs 2024. the public campaign-finance data feed by-size individual totals are not loaded in this 50-state snapshot.
 Spotlight candidates
SULLIVAN, DAN
- In 2024, $915k of $1.89M came from individuals; PAC (other pol. cmte) $524k.
- In 2026, $5.71M of $11.51M came from individuals; PAC (other pol. cmte) $2.28M.
BEGICH, NICHOLAS III
- In 2024, $2.31M of $2.81M came from individuals; PAC (other pol. cmte) $319k.
- In 2026, $3.31M of $6.44M came from individuals; PAC (other pol. cmte) $1.24M.
MURKOWSKI, LISA
- In 2024, $356k of $689k came from individuals; PAC (other pol. cmte) $277k.
- In 2026, $939k of $1.38M came from individuals; PAC (other pol. cmte) $377k.
 Short talking points — money & predicted voting
Open with the model set’s statewide call: GOP favored at about 3% Dem win probability on public campaign-finance + roster features — not a poll. Then the money shape: Alaska federal candidates look balanced in 2026 weball (about $3.90M PAC / $9.96M individual of $19.33M total). Spotlight SULLIVAN, DAN for one concrete receipt picture. Close civic: these are public contribution patterns and a transparent forecast model call — not evidence of wrongdoing, and not a substitute for Cook or election-night counts.
AL — Alabama
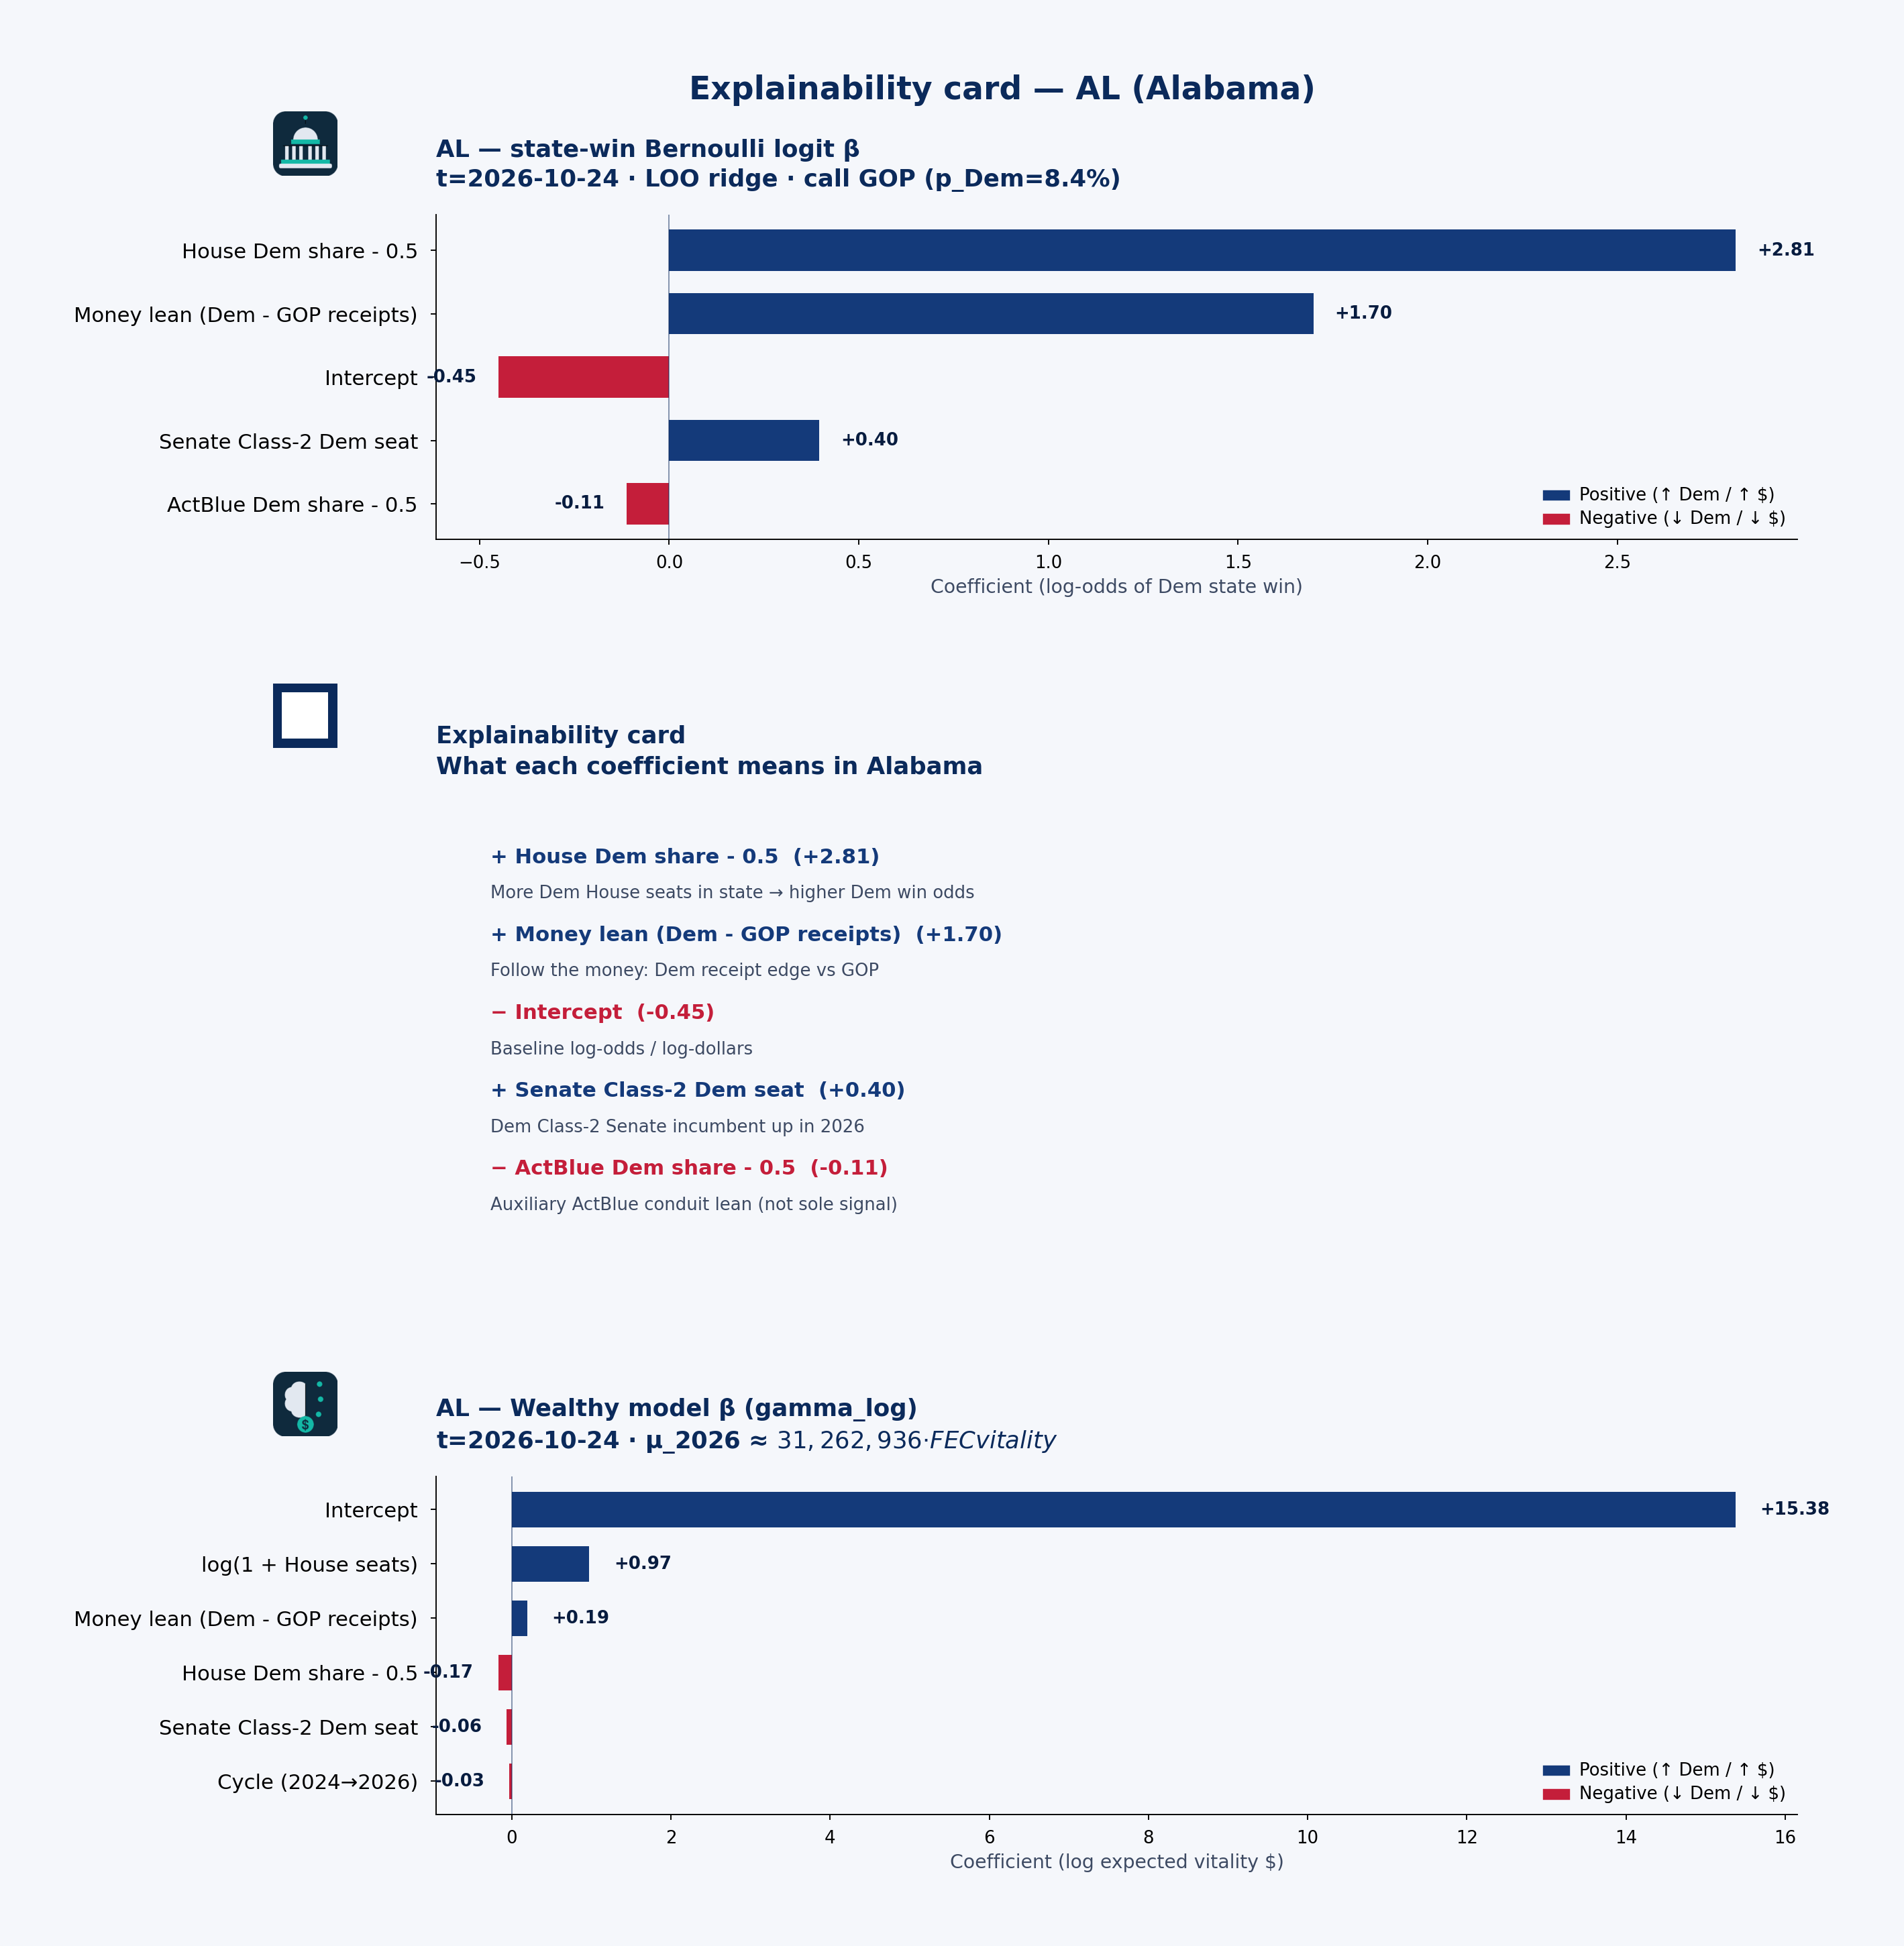 State explainability card · state-win LOO coefficient stability, plain language, and Wealthy model · AL · t=2026-10-24
Statewide call: GOP (p_Dem=8%) · 2026 money shape: balanced
Receipts by cycle (campaign-finance weball)
| Cycle | Candidate | Total receipts | Individual | PAC (other pol. cmte) |
|---|---|---|---|---|
| 2024 | BRITT, KATIE BOYD | $3.91M | $3.02M | $864k |
| 2026 | BRITT, KATIE BOYD | $2.98M | $2.45M | $490k |
| 2024 | FIGURES, SHOMARI C. | $2.63M | $1.88M | $614k |
| 2026 | FIGURES, SHOMARI C. | $2.71M | $1.11M | $1.13M |
| 2026 | MOORE, FELIX BARRY | $4.64M | $2.86M | $1.09M |
| 2024 | PALMER, GARY | $1.73M | $1.05M | $597k |
| 2026 | PALMER, GARY | $1.15M | $589k | $526k |
| 2024 | ROGERS, MICHAEL | $2.93M | $1.64M | $1.08M |
| 2026 | ROGERS, MICHAEL | $2.52M | $1.59M | $875k |
| 2024 | SEWELL, TERRI A. | $3.04M | $973k | $2.06M |
| 2026 | SEWELL, TERRI A. | $2.26M | $447k | $1.81M |
| 2024 | STRONG, DALE WHITNEY | $1.30M | $654k | $576k |
| 2026 | STRONG, DALE WHITNEY | $1.78M | $869k | $745k |
| 2024 | TUBERVILLE, THOMAS H | $2.19M | $1.85M | $324k |
| 2026 | TUBERVILLE, THOMAS H | $726k | $367k | $128k |
PAC & individual money
PAC money was about $6.91M of $19.22M total receipts in 2024 and $7.26M of $20.00M in 2026. Direct committee→candidate 24K (non-memo) ran about $7.13M (2024) / $6.49M (2026). Itemized individual share from Alabama: 60.8% (2024) / 54.5% (2026).
MOORE, FELIX BARRY: Cycle-to-date weball receipts ~$4.64M, with PAC direct 24K $0 → $700k vs 2024. the public campaign-finance data feed by-size individual totals are not loaded in this 50-state snapshot.
Spotlight candidates
MOORE, FELIX BARRY
- In 2026, $2.86M of $4.64M came from individuals; PAC (other pol. cmte) $1.09M.
BRITT, KATIE BOYD
- In 2024, $3.02M of $3.91M came from individuals; PAC (other pol. cmte) $864k.
- In 2026, $2.45M of $2.98M came from individuals; PAC (other pol. cmte) $490k.
SEWELL, TERRI A.
- In 2024, $973k of $3.04M came from individuals; PAC (other pol. cmte) $2.06M.
- In 2026, $447k of $2.26M came from individuals; PAC (other pol. cmte) $1.81M.
Short talking points — money & predicted voting
Open with the model set’s statewide call: GOP favored at about 8% Dem win probability on public campaign-finance + roster features — not a poll. Then the money shape: Alabama federal candidates look balanced in 2026 weball (about $7.26M PAC / $10.91M individual of $20.00M total). Spotlight MOORE, FELIX BARRY for one concrete receipt picture. Close civic: these are public contribution patterns and a transparent forecast model call — not evidence of wrongdoing, and not a substitute for Cook or election-night counts.
AR — Arkansas
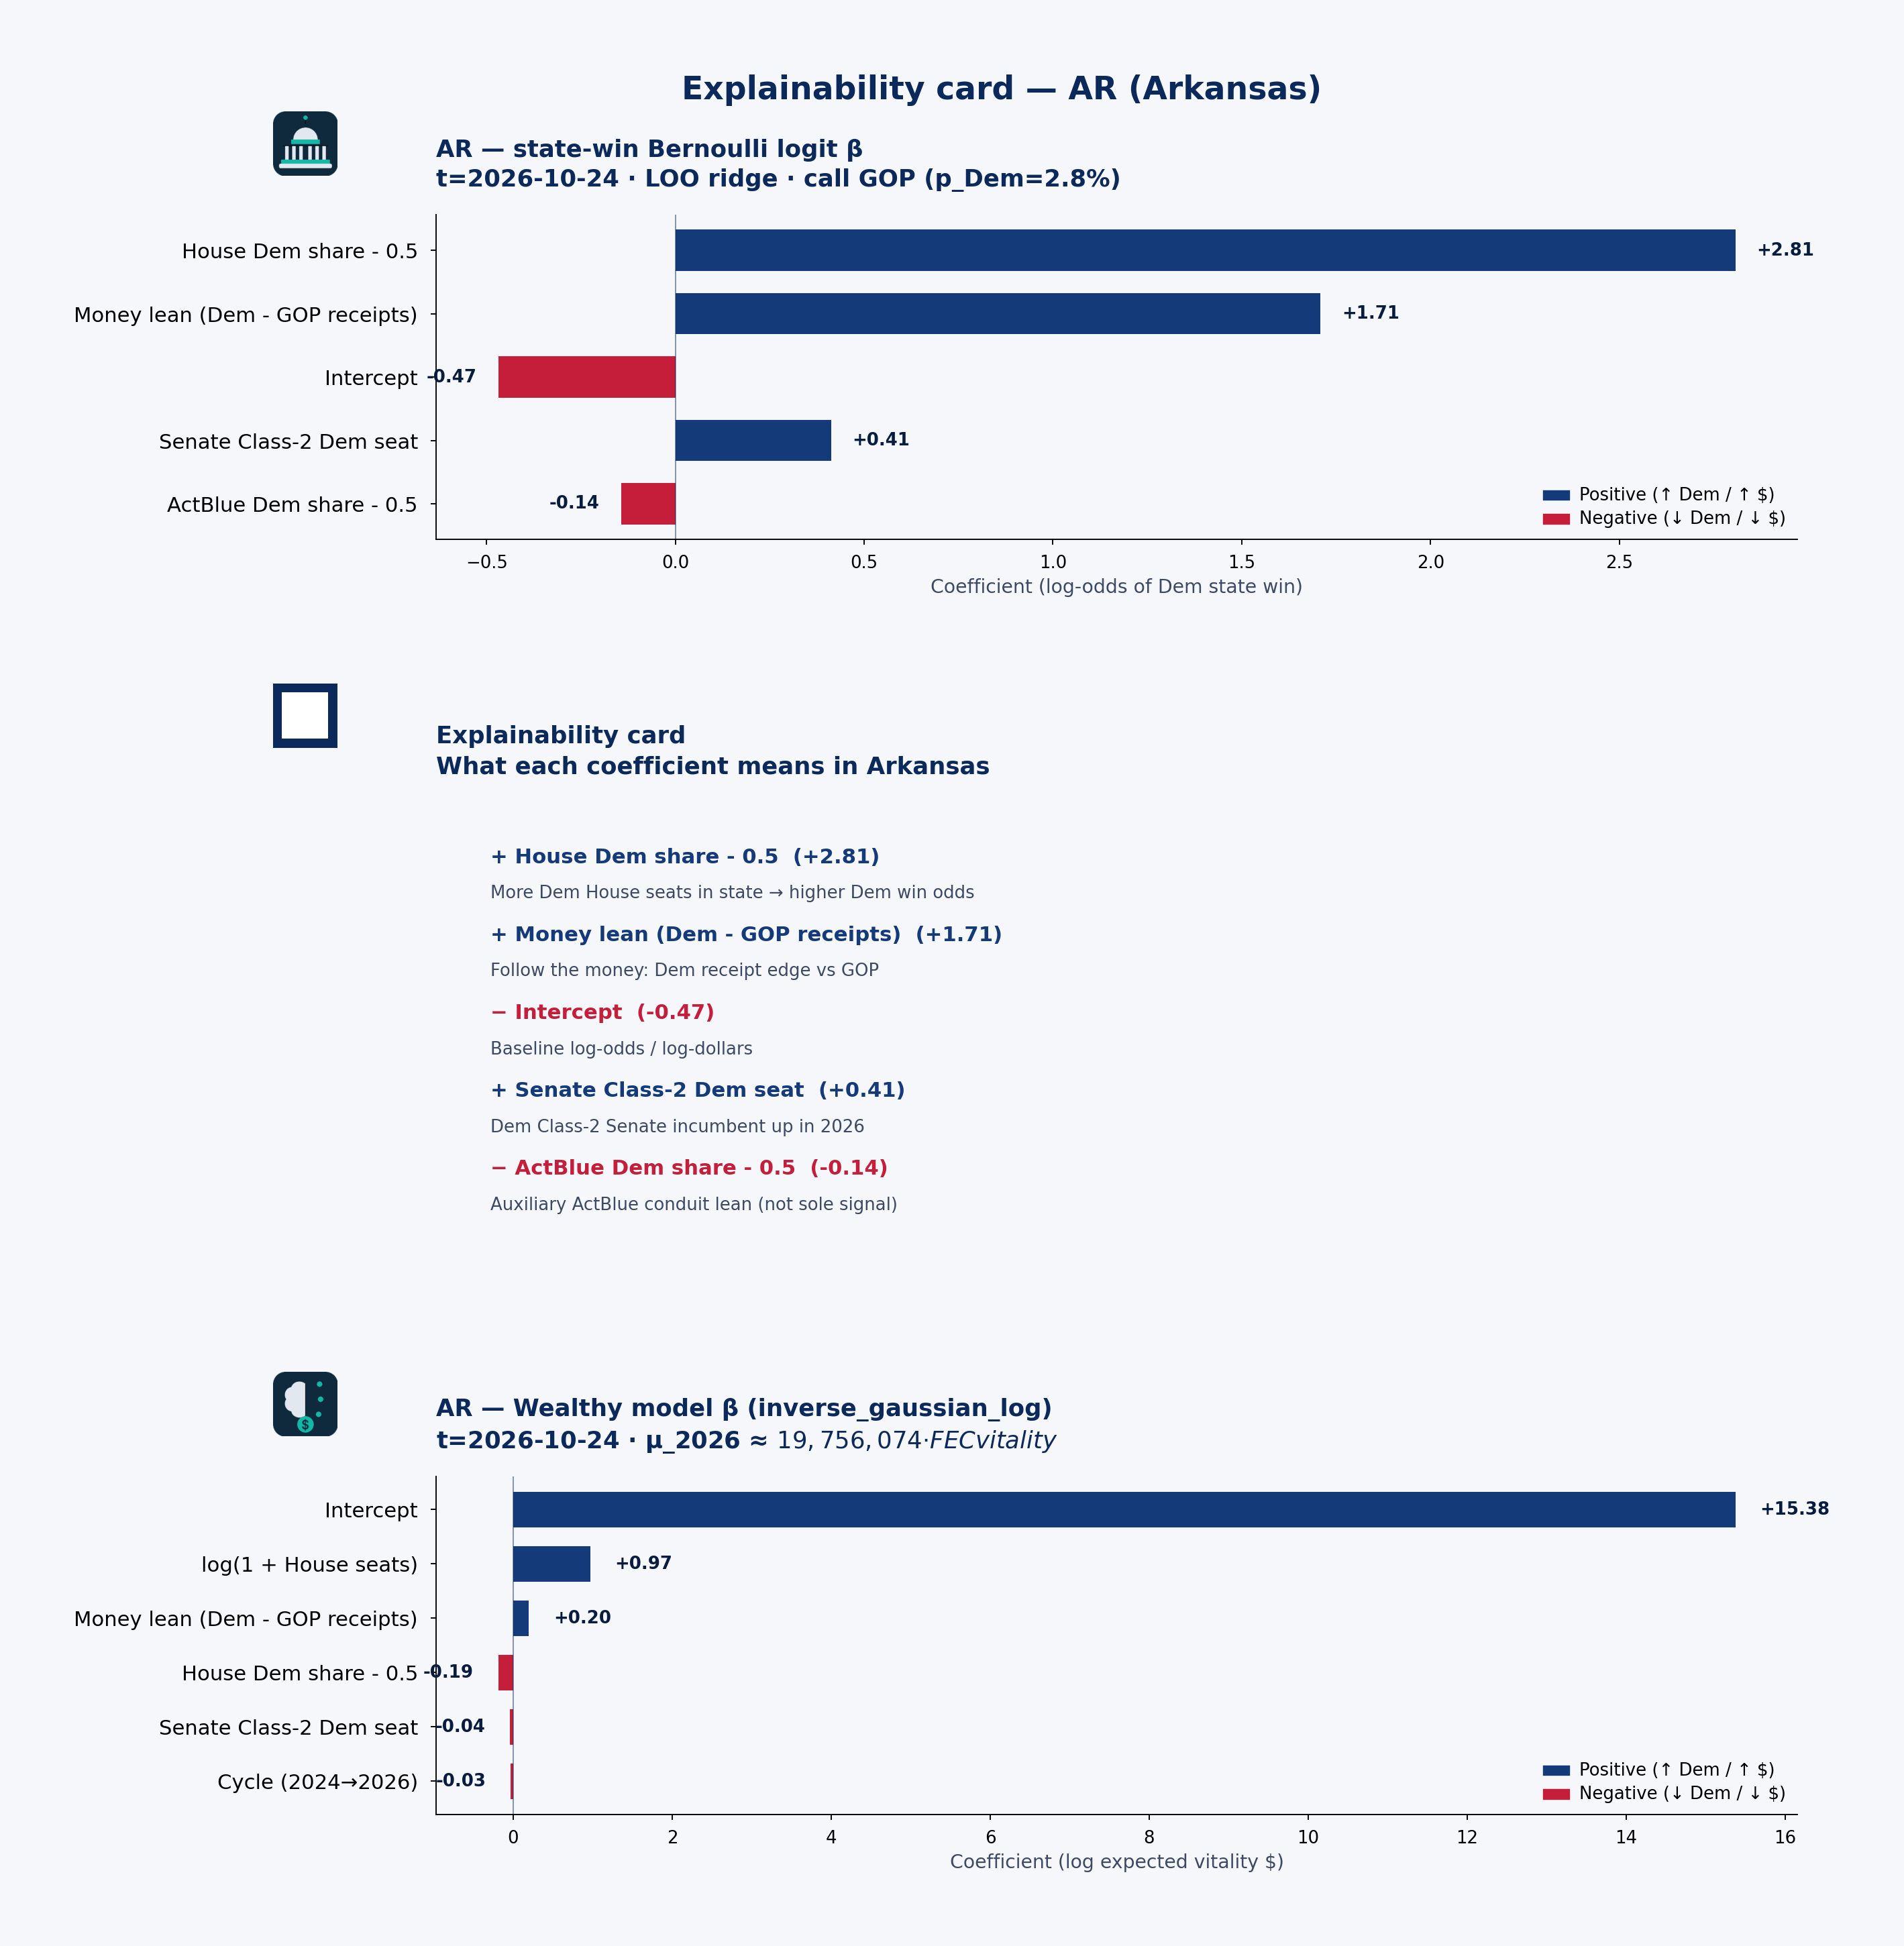 State explainability card · state-win LOO coefficient stability, plain language, and Wealthy model · AR · t=2026-10-24
Statewide call: GOP (p_Dem=3%) · 2026 money shape: balanced
Receipts by cycle (campaign-finance weball)
| Cycle | Candidate | Total receipts | Individual | PAC (other pol. cmte) |
|---|---|---|---|---|
| 2024 | BOOZMAN, SEN. JOHN | $727k | $191k | $441k |
| 2026 | BOOZMAN, SEN. JOHN | $579k | $208k | $302k |
| 2024 | COTTON, THOMAS | $2.49M | $1.54M | $182k |
| 2026 | COTTON, THOMAS | $7.15M | $3.59M | $1.32M |
| 2024 | CRAWFORD, ERIC ALAN RICK | $1.10M | $325k | $740k |
| 2026 | CRAWFORD, ERIC ALAN RICK | $1.14M | $399k | $682k |
| 2024 | HILL, JAMES FRENCH | $3.80M | $1.76M | $1.69M |
| 2026 | HILL, JAMES FRENCH | $5.26M | $2.21M | $1.79M |
| 2024 | WESTERMAN, BRUCE | $2.74M | $1.10M | $1.31M |
| 2026 | WESTERMAN, BRUCE | $2.98M | $976k | $1.26M |
| 2024 | WOMACK, STEPHEN A THE HON | $2.47M | $1.08M | $1.23M |
| 2026 | WOMACK, STEPHEN A THE HON | $2.36M | $1.14M | $1.07M |
PAC & individual money
PAC money was about $5.59M of $13.33M total receipts in 2024 and $6.43M of $19.47M in 2026. Direct committee→candidate 24K (non-memo) ran about $5.69M (2024) / $5.96M (2026). Itemized individual share from Arkansas: 44.9% (2024) / 43.8% (2026).
COTTON, THOMAS: Cycle-to-date weball receipts ~$7.15M, with PAC direct 24K $257k → $1.33M vs 2024. the public campaign-finance data feed by-size individual totals are not loaded in this 50-state snapshot.
Spotlight candidates
COTTON, THOMAS
- In 2024, $1.54M of $2.49M came from individuals; PAC (other pol. cmte) $182k.
- In 2026, $3.59M of $7.15M came from individuals; PAC (other pol. cmte) $1.32M.
HILL, JAMES FRENCH
- In 2024, $1.76M of $3.80M came from individuals; PAC (other pol. cmte) $1.69M.
- In 2026, $2.21M of $5.26M came from individuals; PAC (other pol. cmte) $1.79M.
WESTERMAN, BRUCE
- In 2024, $1.10M of $2.74M came from individuals; PAC (other pol. cmte) $1.31M.
- In 2026, $976k of $2.98M came from individuals; PAC (other pol. cmte) $1.26M.
Short talking points — money & predicted voting
Open with the model set’s statewide call: GOP favored at about 3% Dem win probability on public campaign-finance + roster features — not a poll. Then the money shape: Arkansas federal candidates look balanced in 2026 weball (about $6.43M PAC / $8.52M individual of $19.47M total). Spotlight COTTON, THOMAS for one concrete receipt picture. Close civic: these are public contribution patterns and a transparent forecast model call — not evidence of wrongdoing, and not a substitute for Cook or election-night counts.
AZ — Arizona
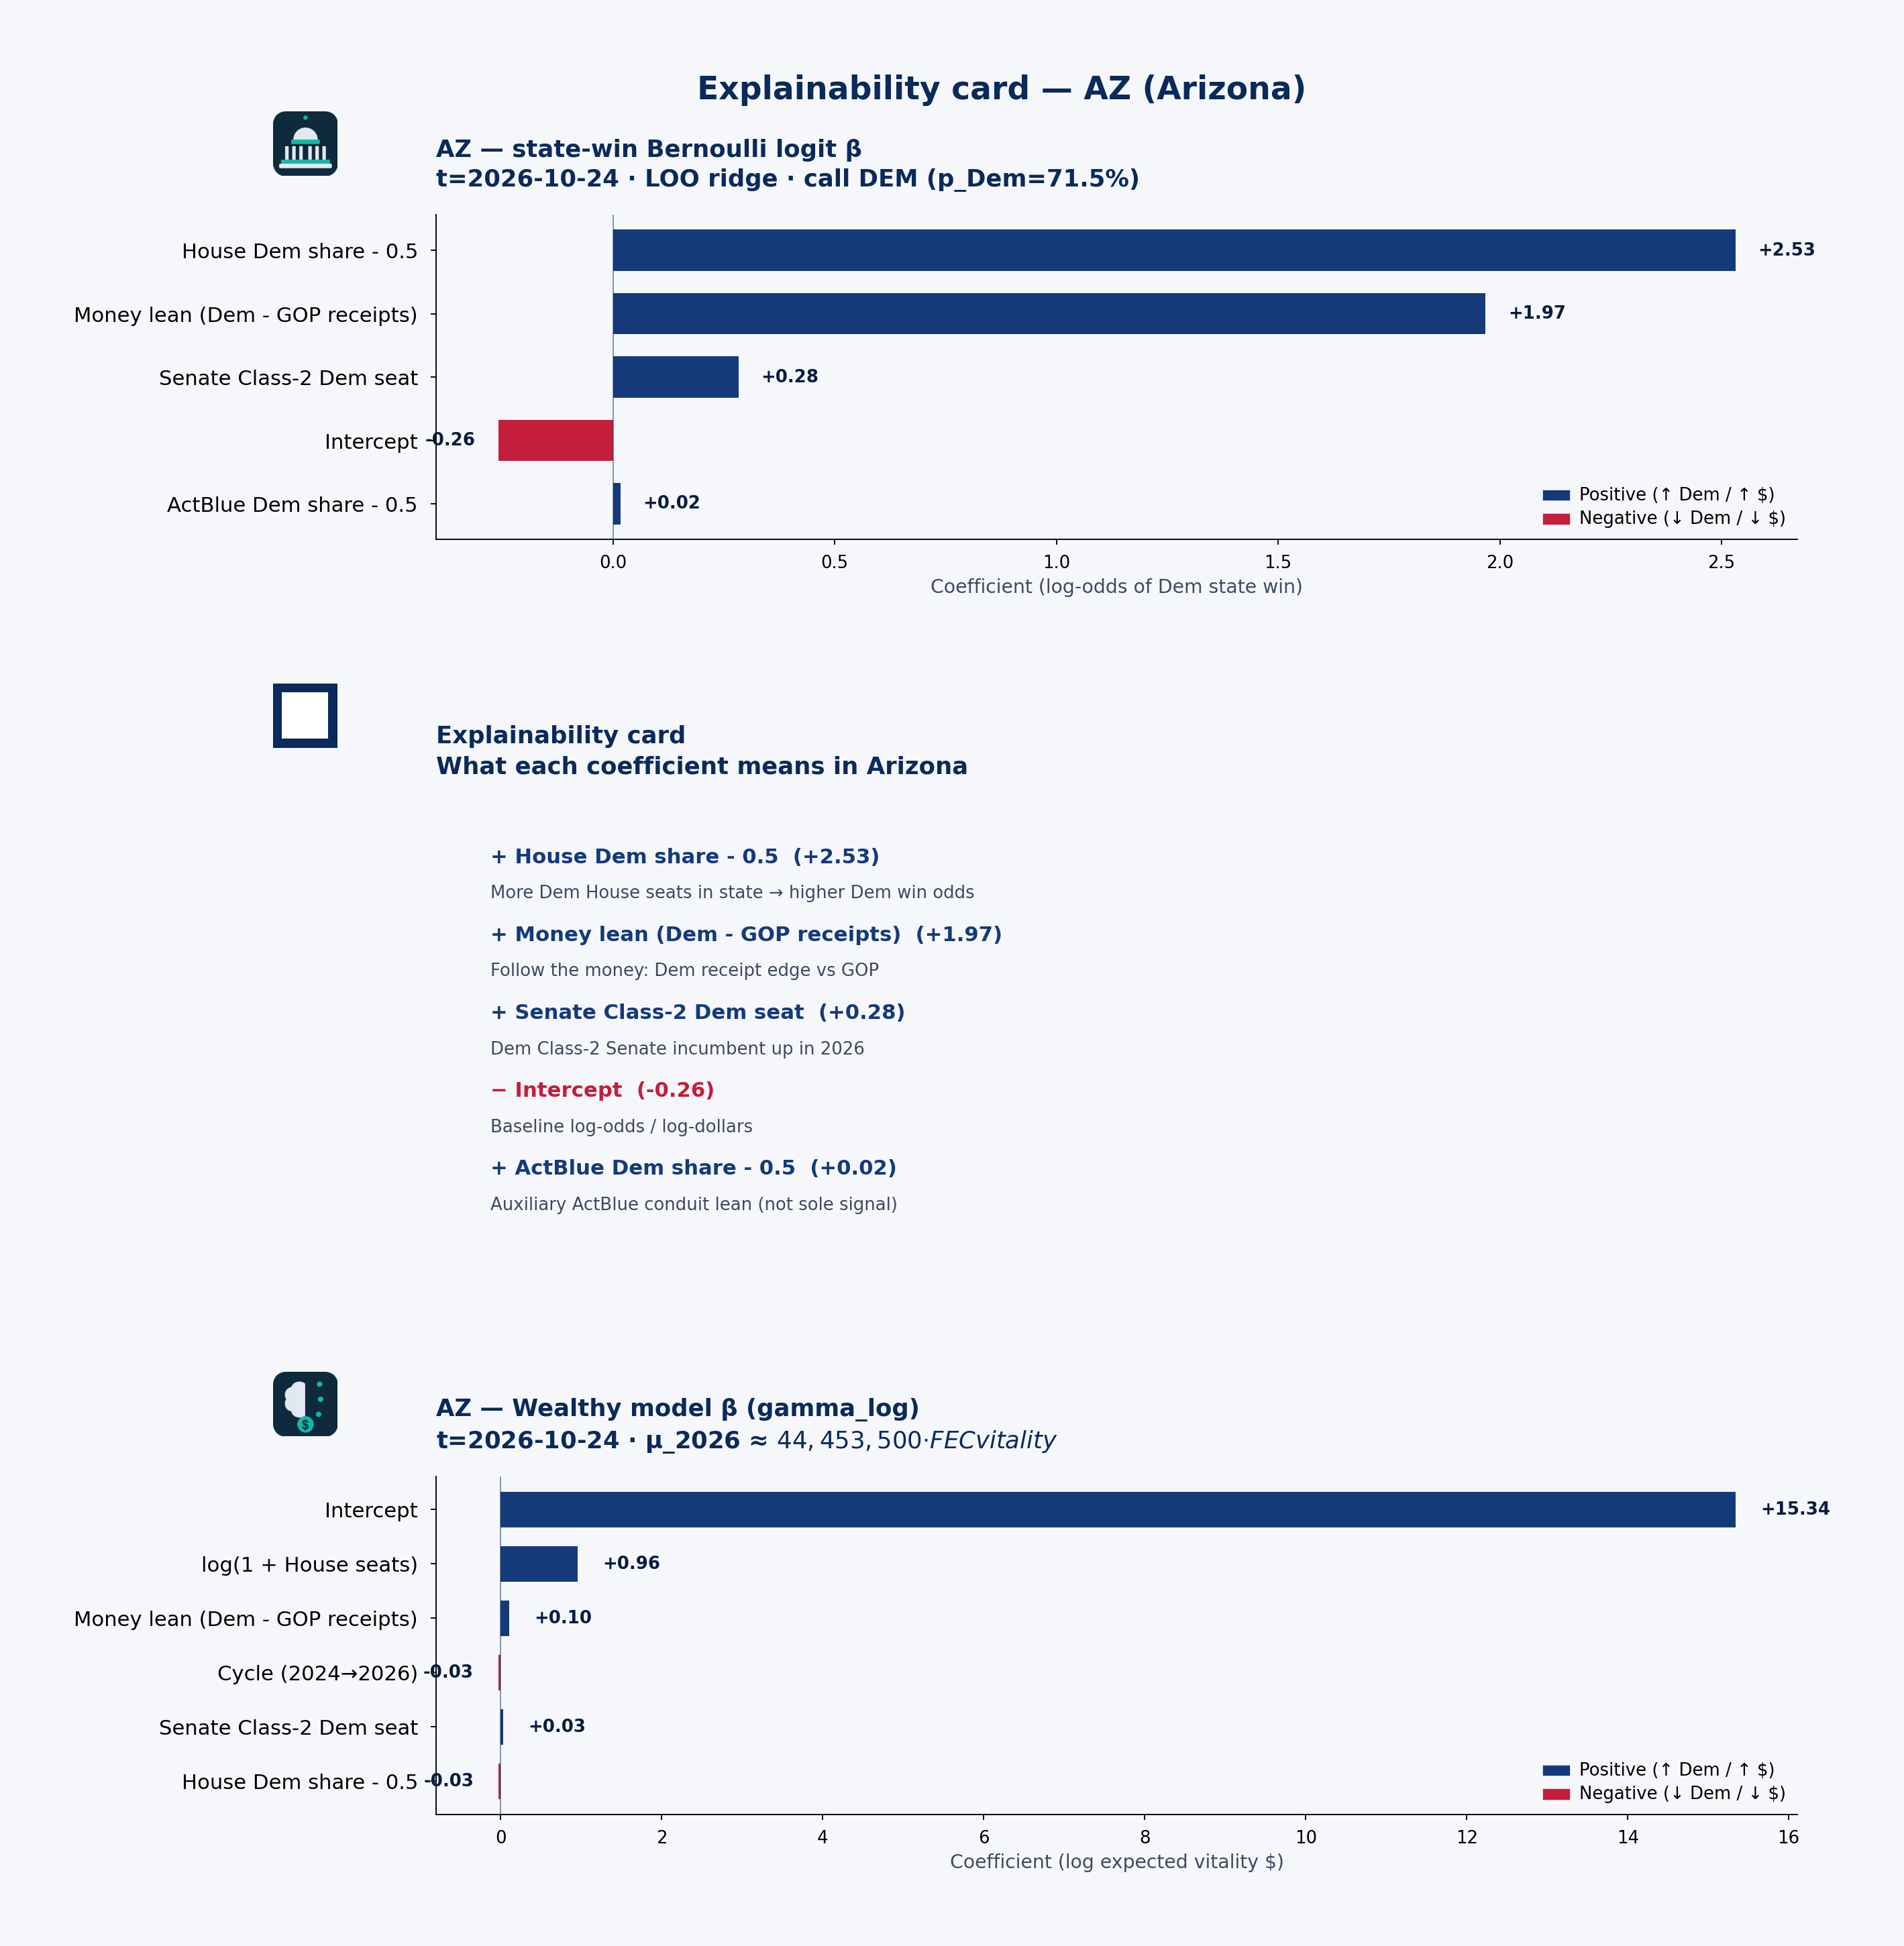 State explainability card · state-win LOO coefficient stability, plain language, and Wealthy model · AZ · t=2026-10-24
Statewide call: DEM (p_Dem=72%) · 2026 money shape: individual-heavy
Receipts by cycle (campaign-finance weball)
| Cycle | Candidate | Total receipts | Individual | PAC (other pol. cmte) |
|---|---|---|---|---|
| 2024 | CISCOMANI, JUAN | $7.04M | $3.63M | $1.94M |
| 2026 | CISCOMANI, JUAN | $7.65M | $3.00M | $2.03M |
| 2024 | CRANE, ELI | $8.56M | $8.41M | $115k |
| 2026 | CRANE, ELI | $11.90M | $10.93M | $126k |
| 2024 | ENGEL, KIRSTEN | $8.46M | $6.84M | $636k |
| 2024 | GALLEGO, RUBEN | $64.66M | $59.39M | $1.78M |
| 2024 | GALLEGO, RUBEN | $64.66M | $59.39M | $1.78M |
| 2026 | GALLEGO, RUBEN | $4.84M | $3.89M | $503k |
| 2026 | GALLEGO, RUBEN | $4.84M | $3.89M | $503k |
| 2024 | KELLY, MARK | $10.86M | $10.65M | $54k |
| 2026 | KELLY, MARK | $47.54M | $47.01M | $36k |
| 2024 | LAKE, KARI | $26.25M | $23.24M | $408k |
| 2026 | LAKE, KARI | $394k | $245k | $0 |
| 2026 | MENDOZA, JOANNA | $11.24M | $9.27M | $798k |
PAC & individual money
PAC money was about $12.69M of $252.18M total receipts in 2024 and $8.78M of $135.90M in 2026. Direct committee→candidate 24K (non-memo) ran about $10.63M (2024) / $6.89M (2026). Itemized individual share from Arizona: 83.4% (2024) / 80.1% (2026).
GALLEGO, RUBEN: Cycle-to-date weball receipts ~$4.84M, with PAC direct 24K $247k → $12k vs 2024. the public campaign-finance data feed by-size individual totals are not loaded in this 50-state snapshot.
Spotlight candidates
GALLEGO, RUBEN
- In 2024, $59.39M of $64.66M came from individuals; PAC (other pol. cmte) $1.78M.
- In 2026, $3.89M of $4.84M came from individuals; PAC (other pol. cmte) $503k.
GALLEGO, RUBEN
- In 2024, $59.39M of $64.66M came from individuals; PAC (other pol. cmte) $1.78M.
- In 2026, $3.89M of $4.84M came from individuals; PAC (other pol. cmte) $503k.
KELLY, MARK
- In 2024, $10.65M of $10.86M came from individuals; PAC (other pol. cmte) $54k.
- In 2026, $47.01M of $47.54M came from individuals; PAC (other pol. cmte) $36k.
Short talking points — money & predicted voting
Open with the model set’s statewide call: DEM favored at about 72% Dem win probability on public campaign-finance + roster features — not a poll. Then the money shape: Arizona federal candidates look individual-heavy in 2026 weball (about $8.78M PAC / $108.83M individual of $135.90M total). Spotlight GALLEGO, RUBEN for one concrete receipt picture. Close civic: these are public contribution patterns and a transparent forecast model call — not evidence of wrongdoing, and not a substitute for Cook or election-night counts.
CA — California
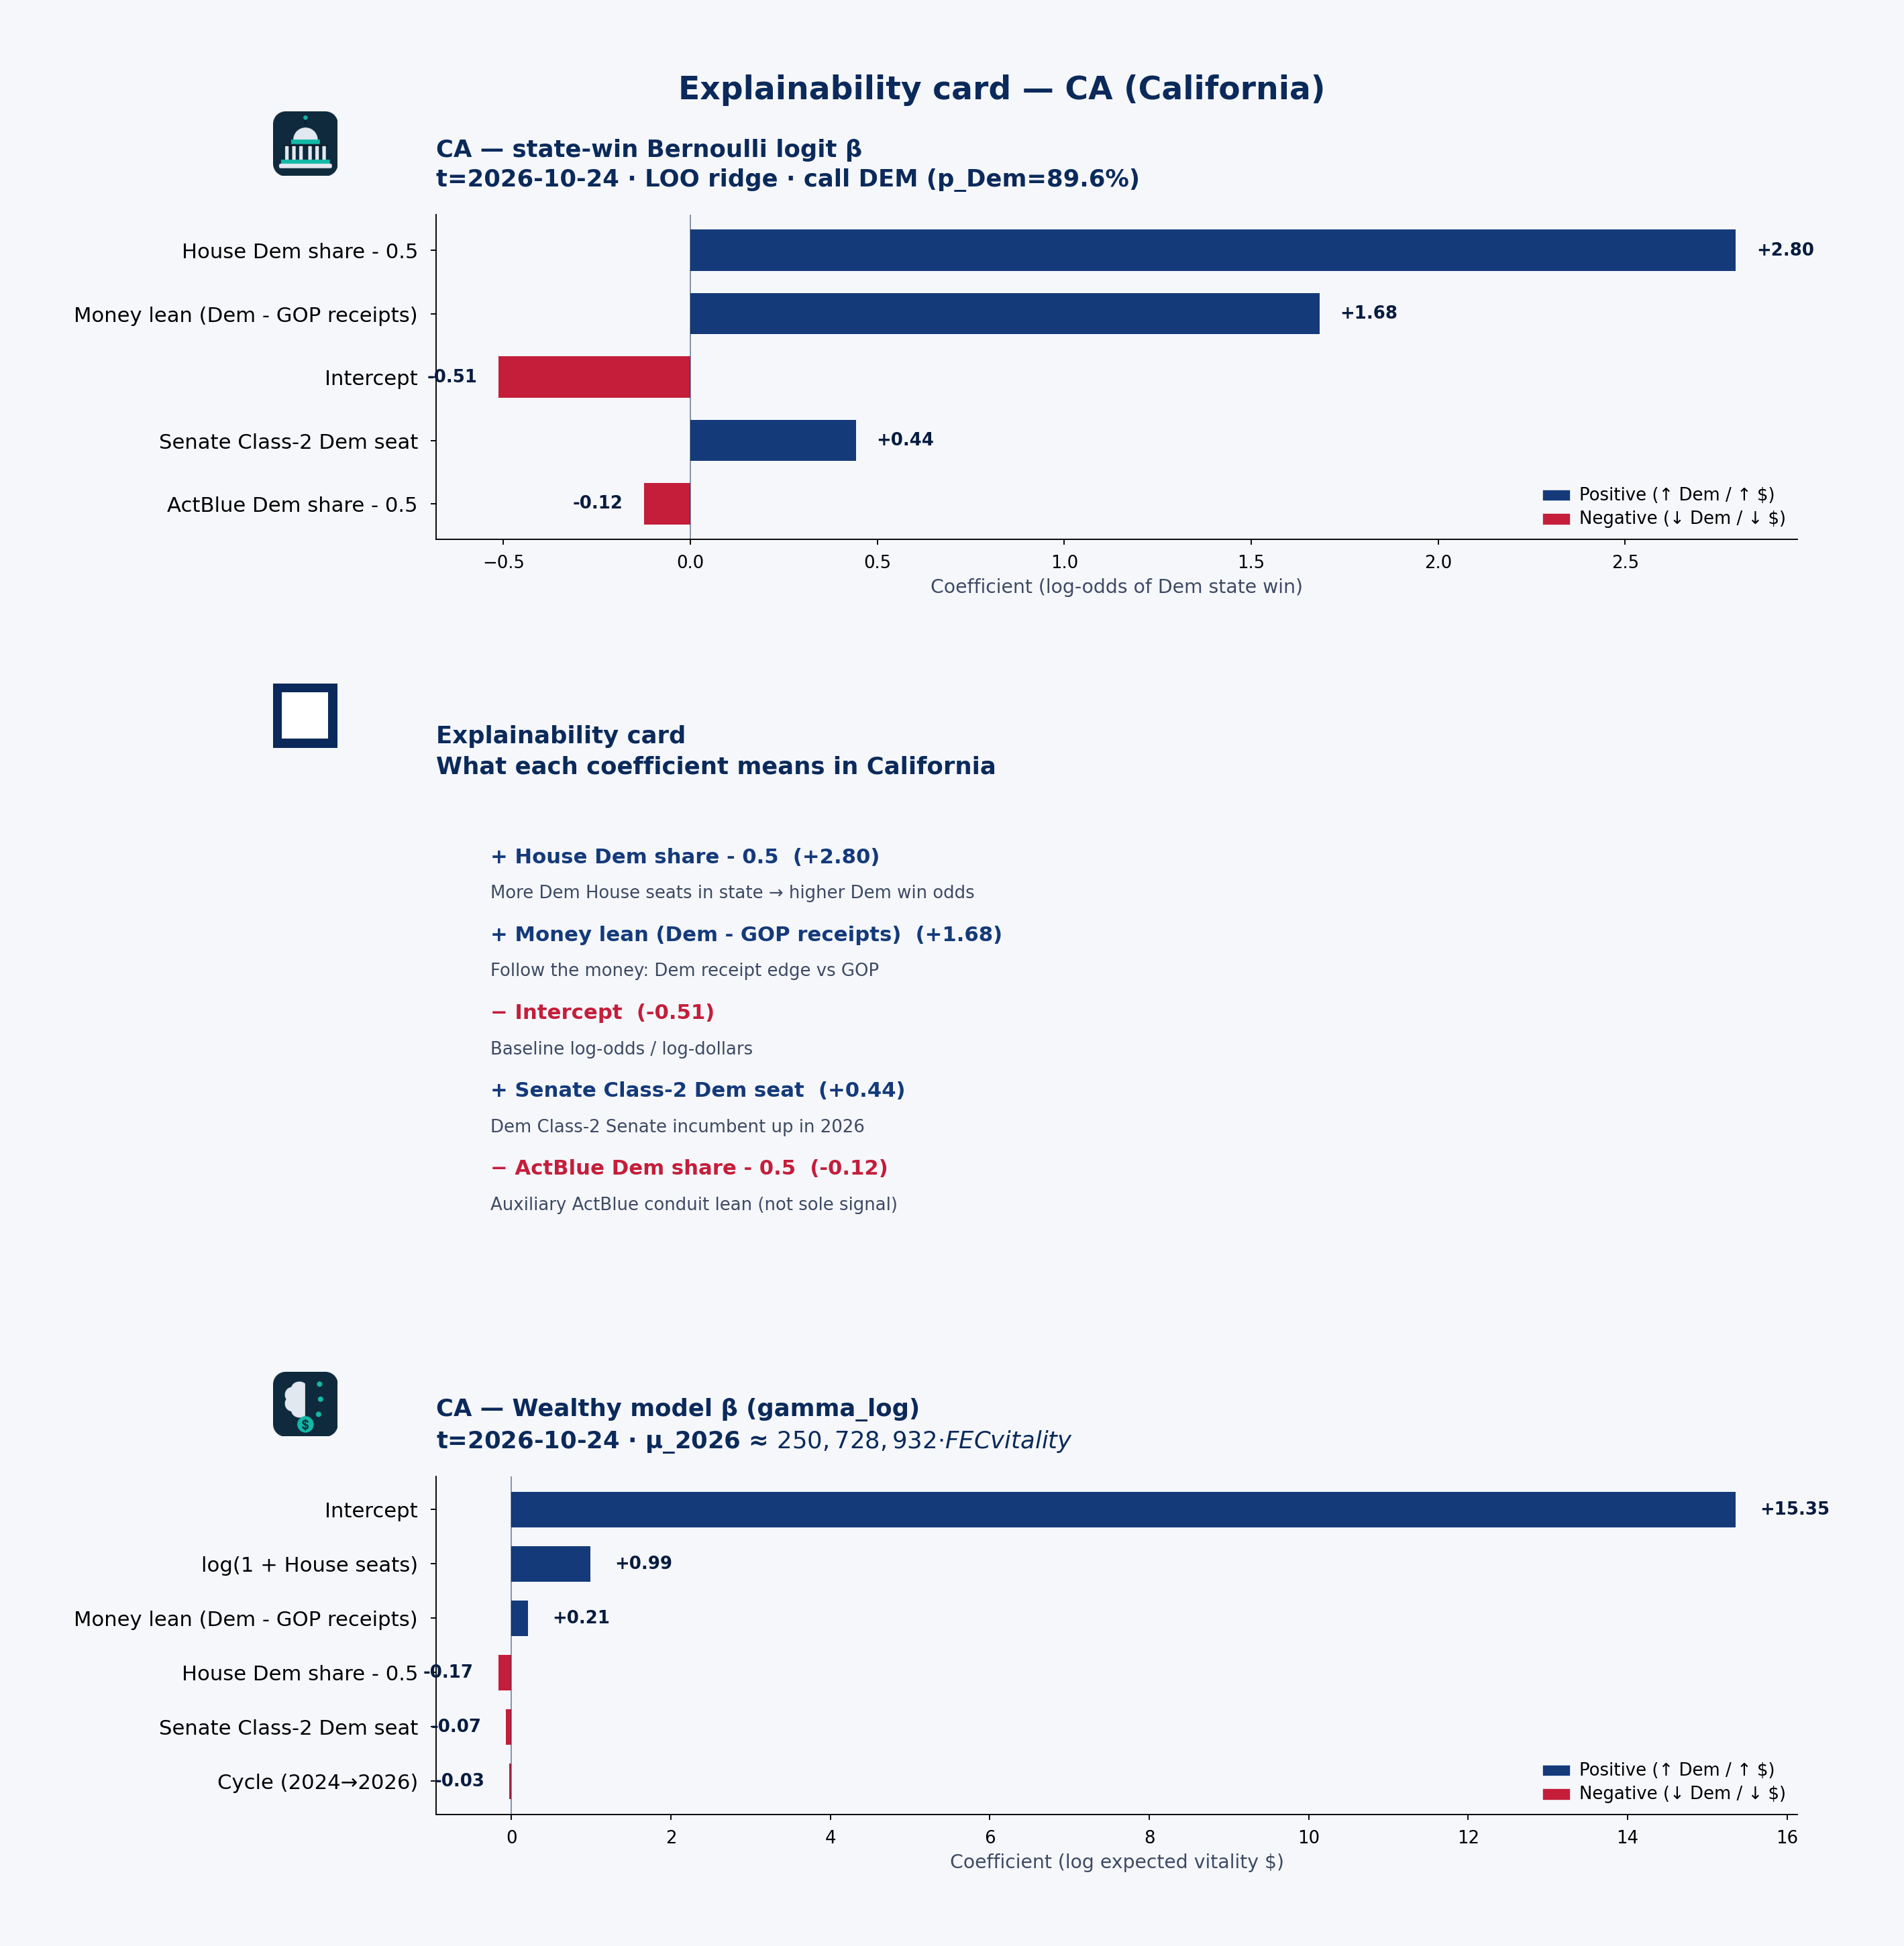 State explainability card · state-win LOO coefficient stability, plain language, and Wealthy model · CA · t=2026-10-24
Statewide call: DEM (p_Dem=90%) · 2026 money shape: balanced
Receipts by cycle (campaign-finance weball)
| Cycle | Candidate | Total receipts | Individual | PAC (other pol. cmte) |
|---|---|---|---|---|
| 2024 | GARVEY, STEVE | $20.36M | $20.24M | $50k |
| 2026 | JONES, ERIC | $18.06M | $3.19M | $0 |
| 2024 | KHANNA, ROHIT | $10.57M | $10.13M | $2k |
| 2026 | KHANNA, ROHIT | $15.32M | $14.26M | $1k |
| 2024 | MCCARTHY, KEVIN | $15.74M | $10.49M | $292k |
| 2026 | MCCARTHY, KEVIN | $725k | $143 | $0 |
| 2024 | PORTER, KATHERINE | $32.53M | $19.14M | $68k |
| 2026 | PORTER, KATHERINE | $211k | $0 | $0 |
| 2024 | ROLLINS, WILL | $12.60M | $9.89M | $826k |
| 2026 | ROLLINS, WILL | $57k | $500 | $2k |
| 2024 | SCHIFF, ADAM | $48.15M | $45.11M | $1.02M |
| 2024 | SCHIFF, ADAM | $48.15M | $45.11M | $1.02M |
| 2026 | SCHIFF, ADAM | $10.40M | $8.46M | $79k |
| 2026 | SCHIFF, ADAM | $10.40M | $8.46M | $79k |
PAC & individual money
PAC money was about $54.86M of $442.41M total receipts in 2024 and $48.76M of $279.86M in 2026. Direct committee→candidate 24K (non-memo) ran about $55.58M (2024) / $42.42M (2026). Itemized individual share from California: 71.5% (2024) / 59.1% (2026).
SCHIFF, ADAM: Cycle-to-date weball receipts ~$10.40M, with PAC direct 24K $108k → $4k vs 2024. the public campaign-finance data feed by-size individual totals are not loaded in this 50-state snapshot.
Spotlight candidates
SCHIFF, ADAM
- In 2024, $45.11M of $48.15M came from individuals; PAC (other pol. cmte) $1.02M.
- In 2026, $8.46M of $10.40M came from individuals; PAC (other pol. cmte) $79k.
SCHIFF, ADAM
- In 2024, $45.11M of $48.15M came from individuals; PAC (other pol. cmte) $1.02M.
- In 2026, $8.46M of $10.40M came from individuals; PAC (other pol. cmte) $79k.
PORTER, KATHERINE
- In 2024, $19.14M of $32.53M came from individuals; PAC (other pol. cmte) $68k.
- In 2026, $0 of $211k came from individuals; PAC (other pol. cmte) $0.
Short talking points — money & predicted voting
Open with the model set’s statewide call: DEM favored at about 90% Dem win probability on public campaign-finance + roster features — not a poll. Then the money shape: California federal candidates look balanced in 2026 weball (about $48.76M PAC / $165.31M individual of $279.86M total). Spotlight SCHIFF, ADAM for one concrete receipt picture. Close civic: these are public contribution patterns and a transparent forecast model call — not evidence of wrongdoing, and not a substitute for Cook or election-night counts.
CO — Colorado
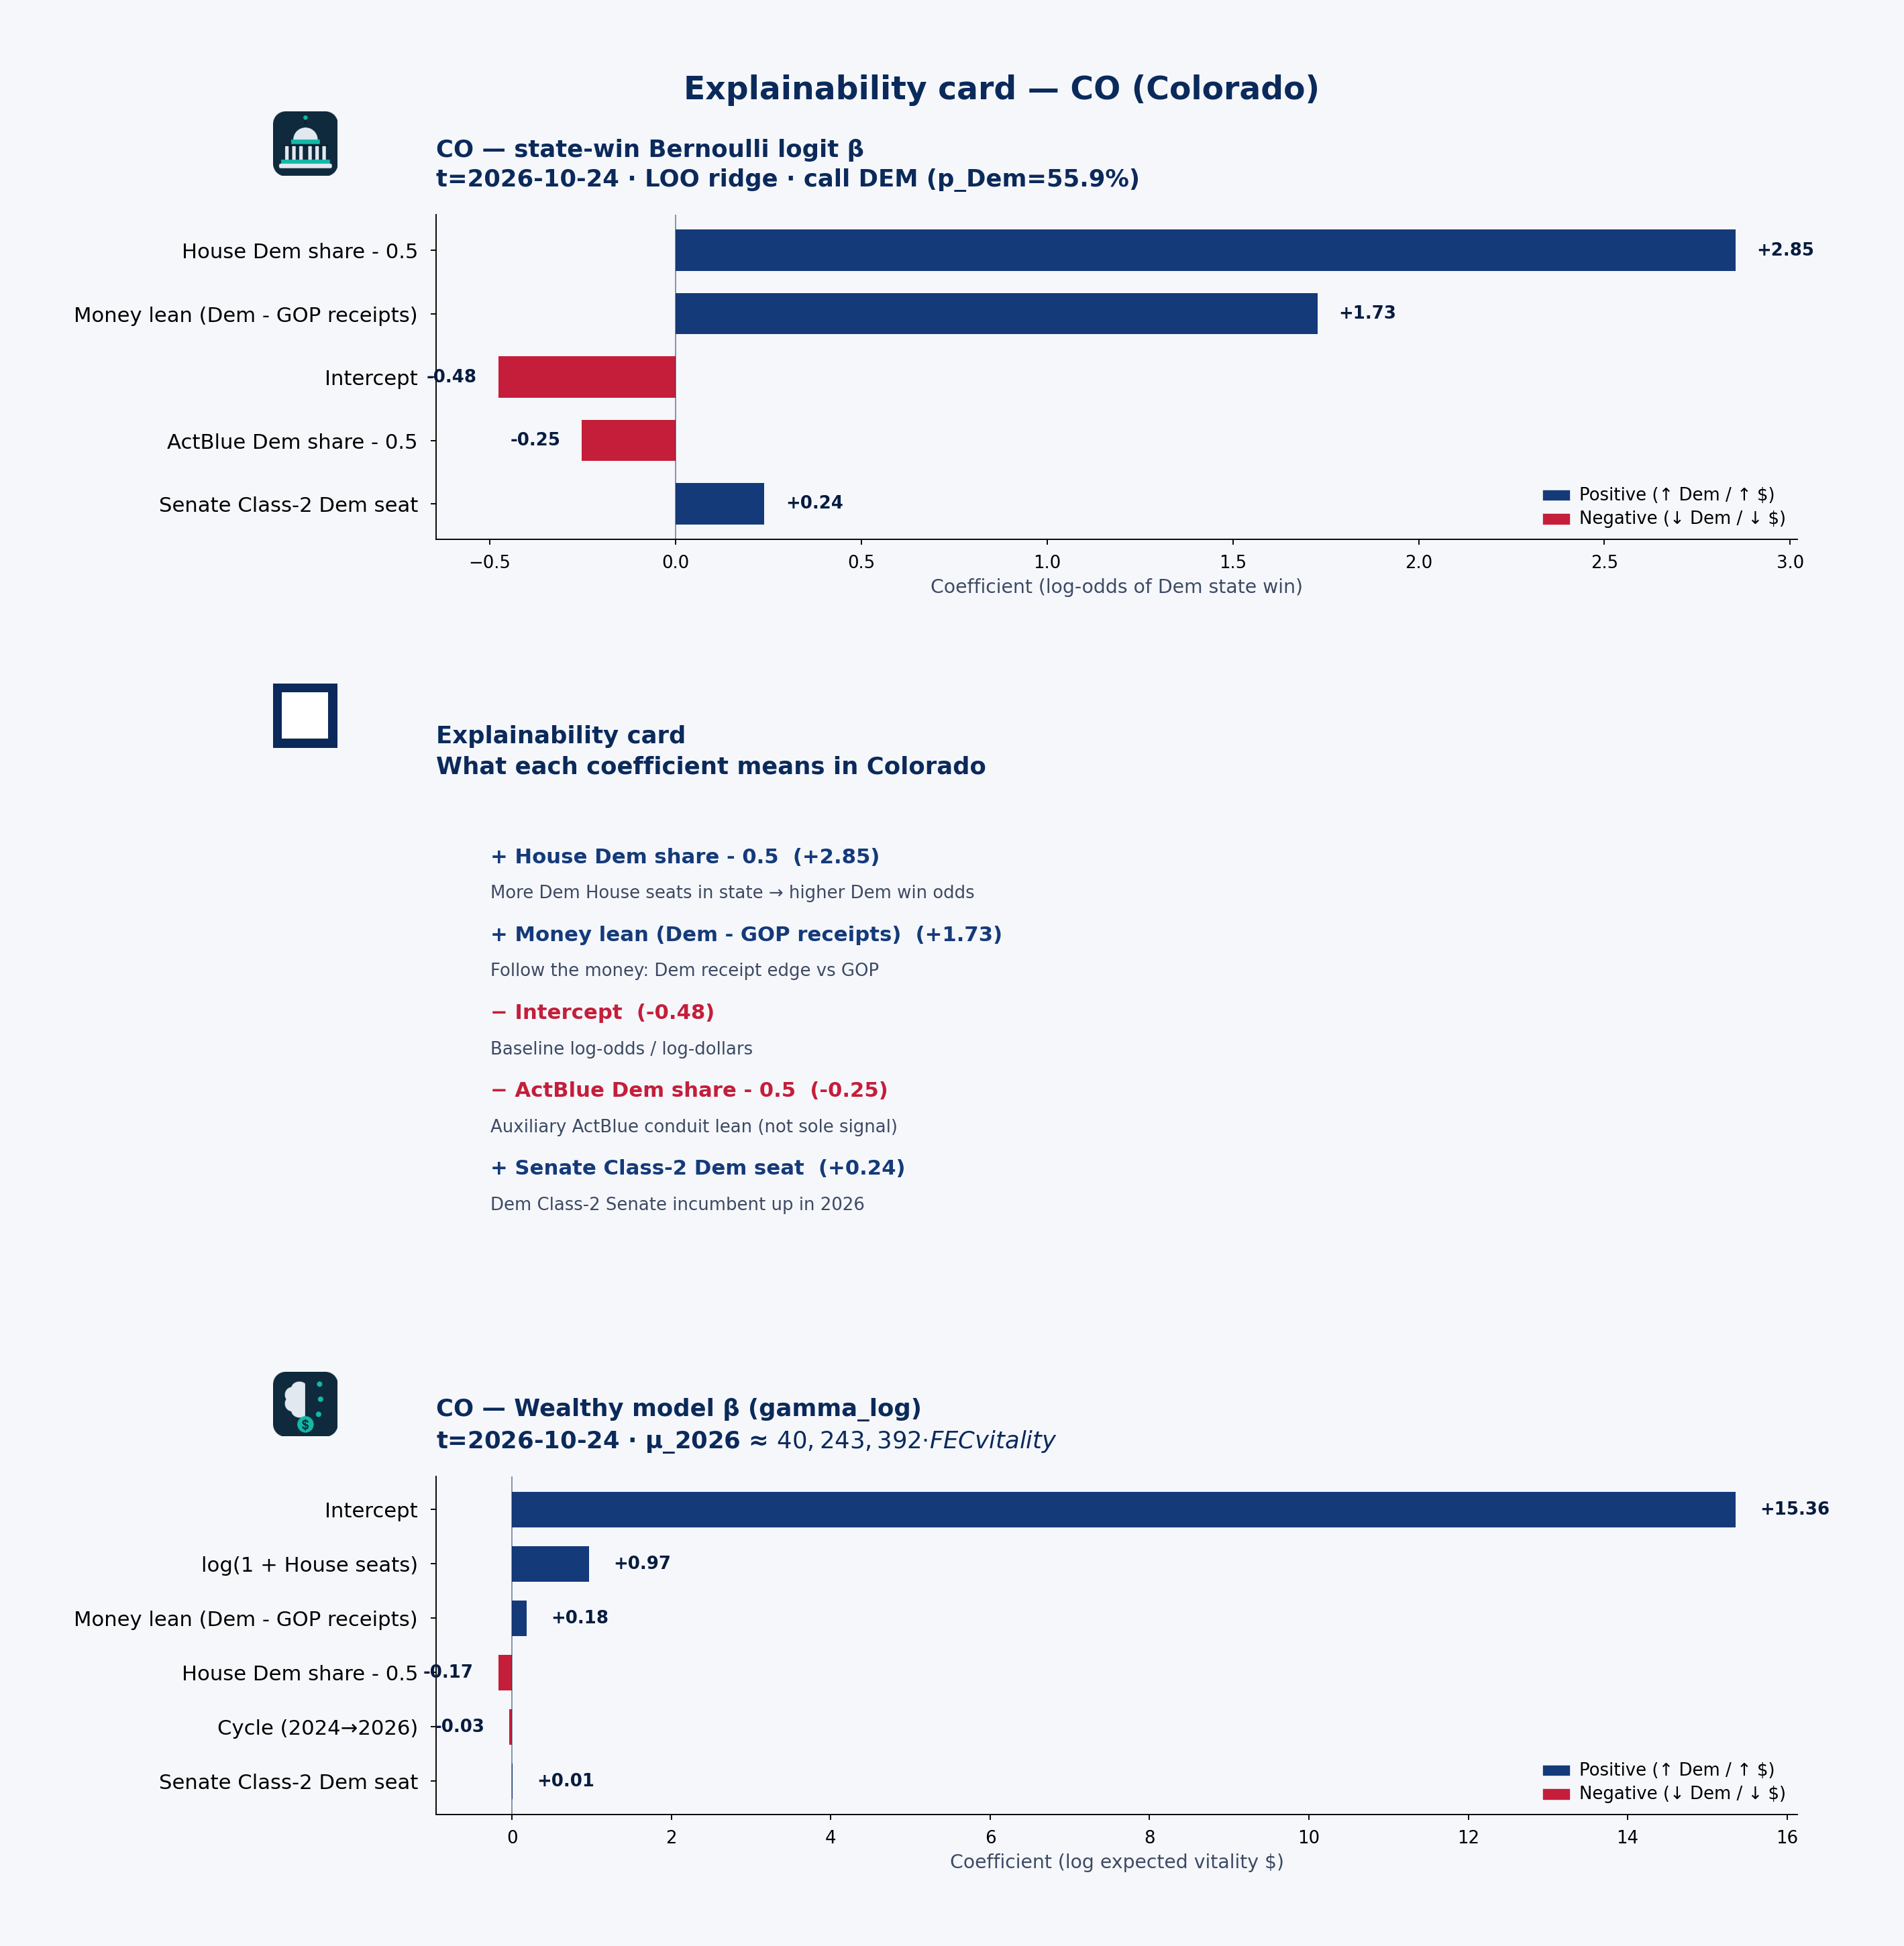 State explainability card · state-win LOO coefficient stability, plain language, and Wealthy model · CO · t=2026-10-24
Statewide call: DEM (p_Dem=56%) · 2026 money shape: balanced
Receipts by cycle (campaign-finance weball)
| Cycle | Candidate | Total receipts | Individual | PAC (other pol. cmte) |
|---|---|---|---|---|
| 2024 | BOEBERT, LAUREN | $4.82M | $4.18M | $256k |
| 2026 | BOEBERT, LAUREN | $1.23M | $959k | $184k |
| 2024 | CRANK, JEFF | $1.13M | $733k | $356k |
| 2026 | CRANK, JEFF | $2.87M | $1.10M | $1.04M |
| 2024 | CROW, JASON | $2.21M | $1.82M | $281k |
| 2026 | CROW, JASON | $4.01M | $3.50M | $280k |
| 2024 | EVANS, TIMOTHY GABRIEL JOSEPH | $2.73M | $1.48M | $612k |
| 2026 | EVANS, TIMOTHY GABRIEL JOSEPH | $7.25M | $3.27M | $1.78M |
| 2024 | HICKENLOOPER, JOHN W. | $1.16M | $929k | $114k |
| 2026 | HICKENLOOPER, JOHN W. | $9.53M | $6.67M | $1.07M |
| 2024 | HURD, JEFFREY | $2.77M | $2.24M | $486k |
| 2026 | HURD, JEFFREY | $4.17M | $2.28M | $705k |
| 2024 | NEGUSE, JOSEPH | $2.43M | $1.40M | $941k |
| 2026 | NEGUSE, JOSEPH | $3.34M | $1.90M | $1.24M |
| 2024 | PETTERSEN, BRITTANY LOUISE | $2.49M | $1.17M | $1.26M |
| 2026 | PETTERSEN, BRITTANY LOUISE | $2.26M | $1.04M | $1.19M |
PAC & individual money
PAC money was about $5.06M of $22.03M total receipts in 2024 and $8.51M of $36.58M in 2026. Direct committee→candidate 24K (non-memo) ran about $5.23M (2024) / $7.60M (2026). Itemized individual share from Colorado: 69.4% (2024) / 58.9% (2026).
HICKENLOOPER, JOHN W.: Cycle-to-date weball receipts ~$9.53M, with PAC direct 24K $157k → $1.04M vs 2024. the public campaign-finance data feed by-size individual totals are not loaded in this 50-state snapshot.
Spotlight candidates
HICKENLOOPER, JOHN W.
- In 2024, $929k of $1.16M came from individuals; PAC (other pol. cmte) $114k.
- In 2026, $6.67M of $9.53M came from individuals; PAC (other pol. cmte) $1.07M.
EVANS, TIMOTHY GABRIEL JOSEPH
- In 2024, $1.48M of $2.73M came from individuals; PAC (other pol. cmte) $612k.
- In 2026, $3.27M of $7.25M came from individuals; PAC (other pol. cmte) $1.78M.
BOEBERT, LAUREN
- In 2024, $4.18M of $4.82M came from individuals; PAC (other pol. cmte) $256k.
- In 2026, $959k of $1.23M came from individuals; PAC (other pol. cmte) $184k.
Short talking points — money & predicted voting
Open with the model set’s statewide call: DEM favored at about 56% Dem win probability on public campaign-finance + roster features — not a poll. Then the money shape: Colorado federal candidates look balanced in 2026 weball (about $8.51M PAC / $21.54M individual of $36.58M total). Spotlight HICKENLOOPER, JOHN W. for one concrete receipt picture. Close civic: these are public contribution patterns and a transparent forecast model call — not evidence of wrongdoing, and not a substitute for Cook or election-night counts.
CT — Connecticut
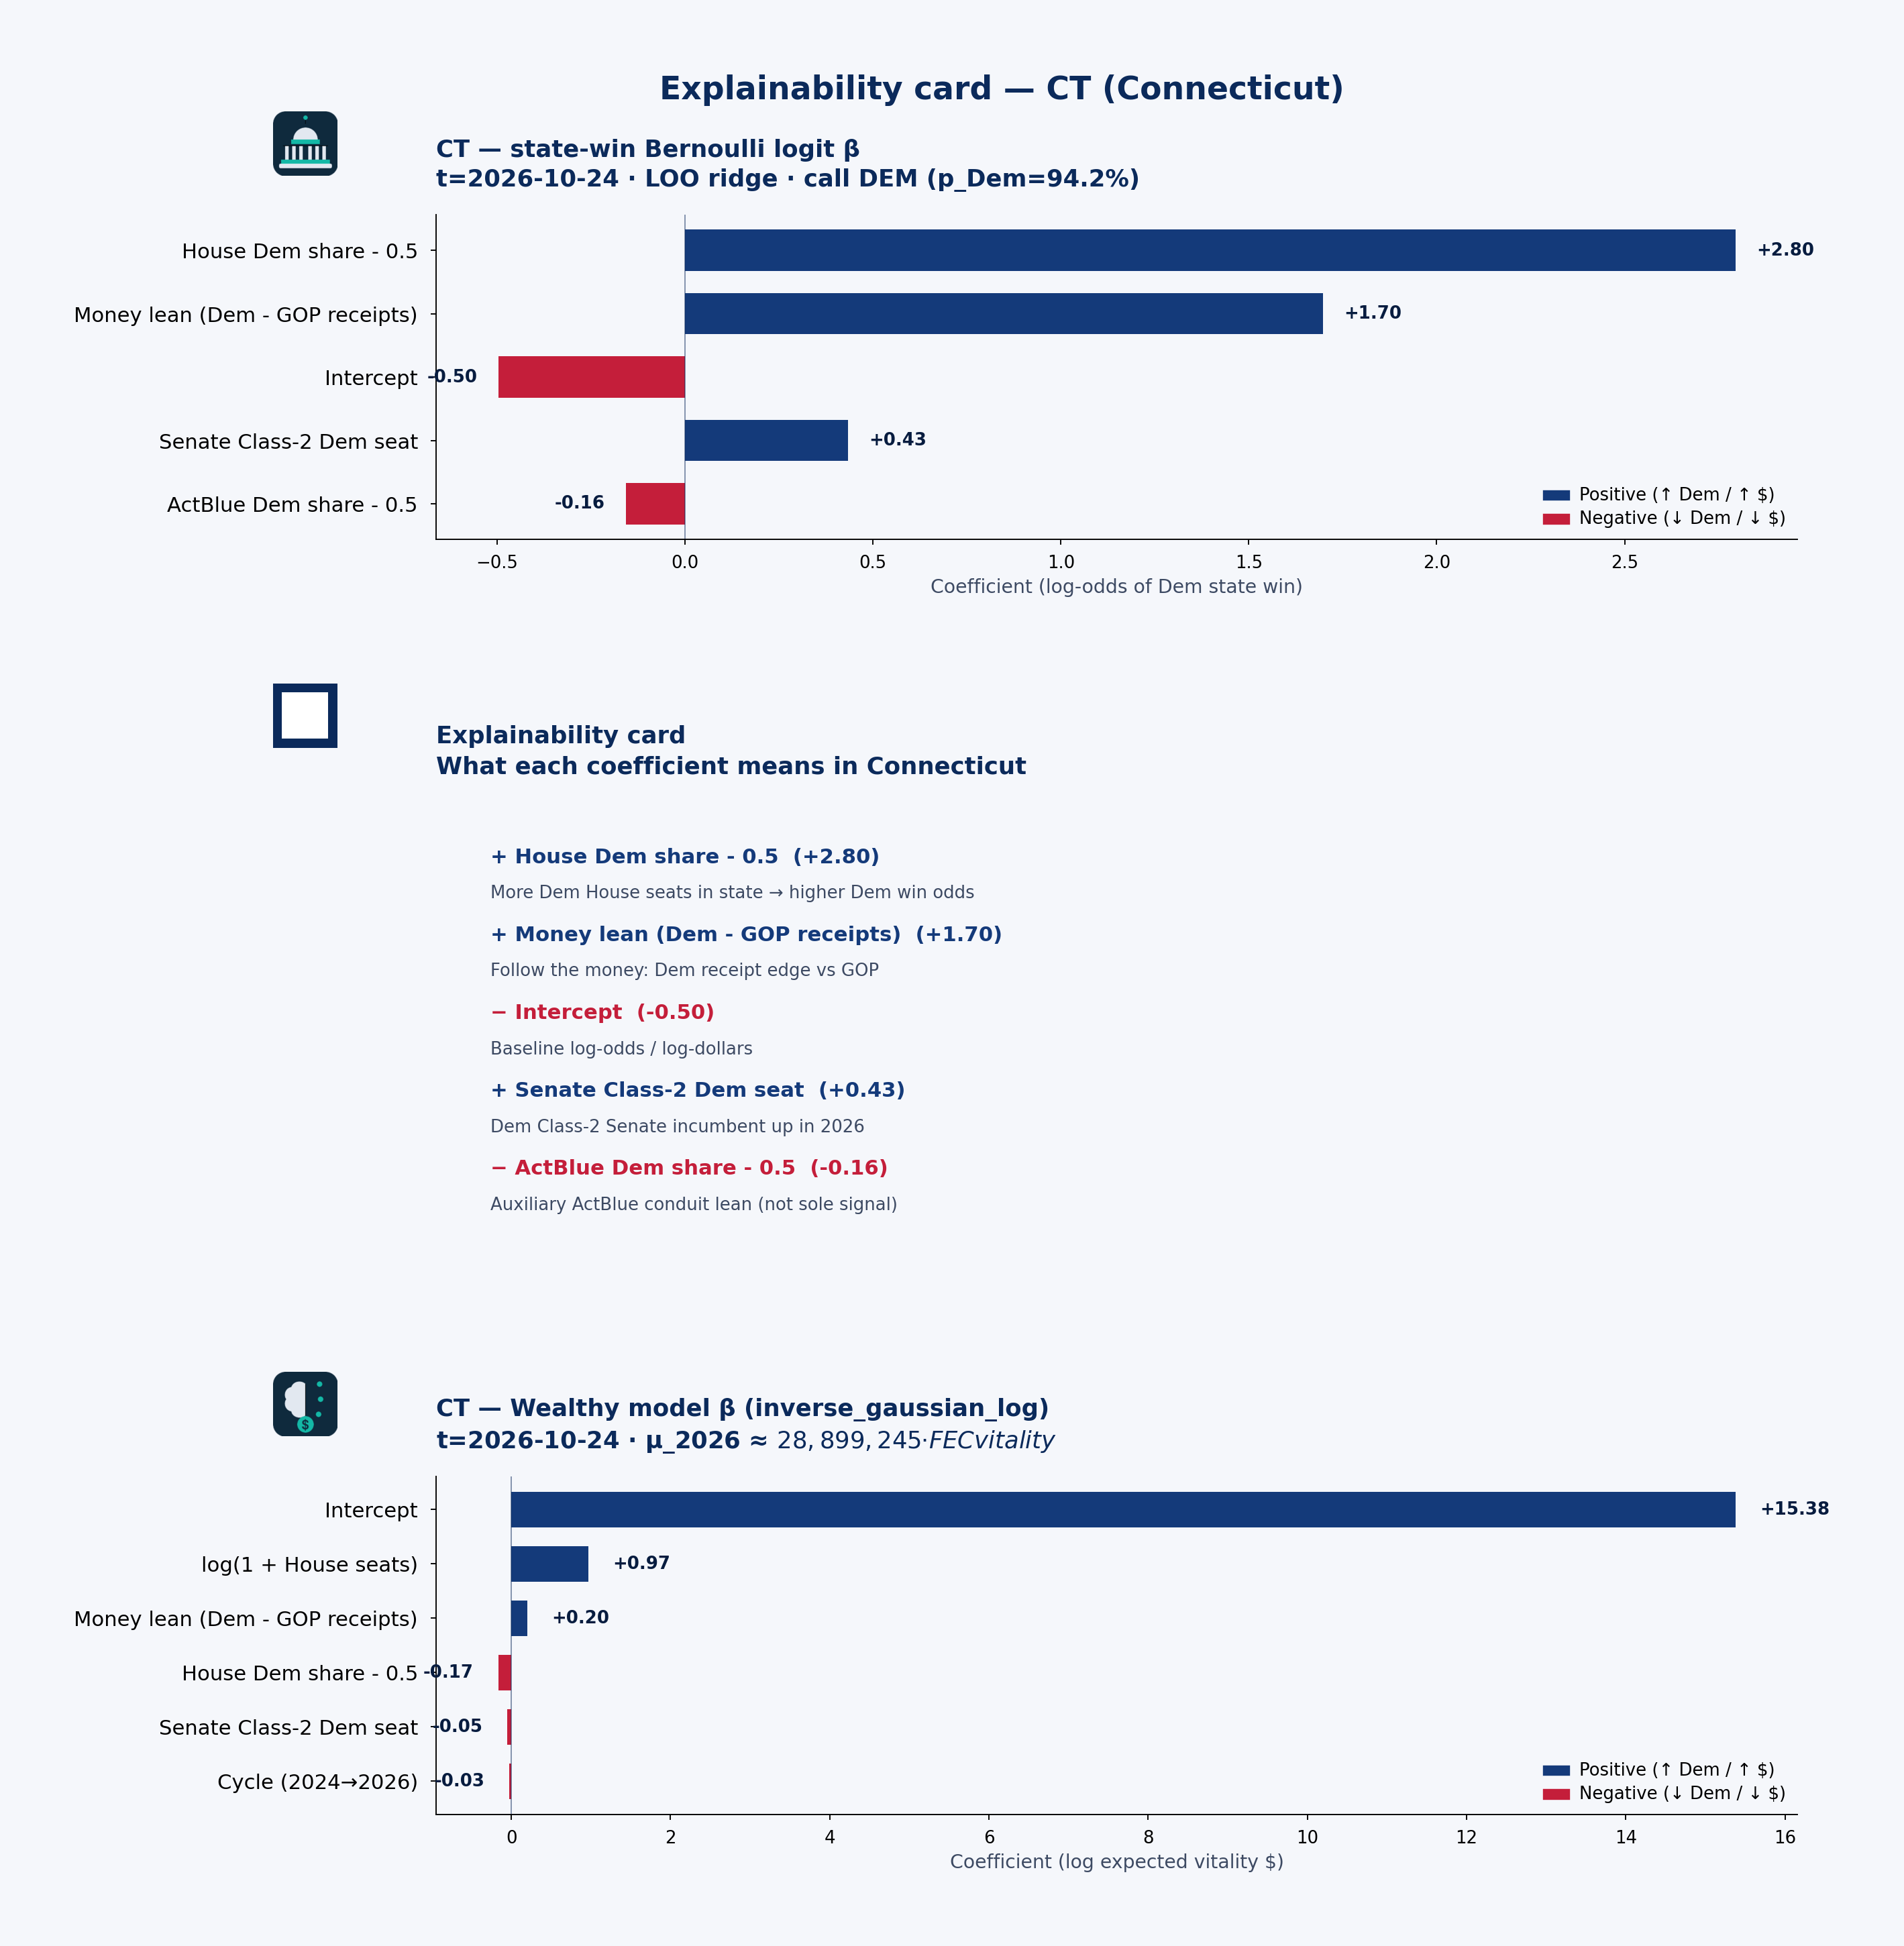 State explainability card · state-win LOO coefficient stability, plain language, and Wealthy model · CT · t=2026-10-24
Statewide call: DEM (p_Dem=94%) · 2026 money shape: balanced
Receipts by cycle (campaign-finance weball)
| Cycle | Candidate | Total receipts | Individual | PAC (other pol. cmte) |
|---|---|---|---|---|
| 2024 | BLUMENTHAL, RICHARD | $399k | $143k | $73k |
| 2026 | BLUMENTHAL, RICHARD | $771k | $338k | $112k |
| 2024 | COURTNEY, JOSEPH | $1.32M | $603k | $651k |
| 2026 | COURTNEY, JOSEPH | $967k | $428k | $533k |
| 2024 | DELAURO, ROSA L | $1.75M | $799k | $867k |
| 2026 | DELAURO, ROSA L | $1.62M | $717k | $764k |
| 2024 | HAYES, JAHANA | $4.22M | $2.97M | $944k |
| 2026 | HAYES, JAHANA | $1.72M | $826k | $780k |
| 2024 | HIMES, JIM | $2.12M | $916k | $1.03M |
| 2026 | HIMES, JIM | $1.70M | $545k | $1.01M |
| 2024 | LARSON, JOHN B | $1.54M | $481k | $1.04M |
| 2026 | LARSON, JOHN B | $2.98M | $1.62M | $1.34M |
| 2024 | MURPHY, CHRISTOPHER S | $12.79M | $12.06M | $54k |
| 2026 | MURPHY, CHRISTOPHER S | $14.02M | $12.62M | $0 |
PAC & individual money
PAC money was about $4.67M of $24.14M total receipts in 2024 and $4.54M of $23.78M in 2026. Direct committee→candidate 24K (non-memo) ran about $4.85M (2024) / $4.20M (2026). Itemized individual share from Connecticut: 74.4% (2024) / 71.9% (2026).
MURPHY, CHRISTOPHER S: Cycle-to-date weball receipts ~$14.02M, with PAC direct 24K $135k → $14k vs 2024. the public campaign-finance data feed by-size individual totals are not loaded in this 50-state snapshot.
Spotlight candidates
MURPHY, CHRISTOPHER S
- In 2024, $12.06M of $12.79M came from individuals; PAC (other pol. cmte) $54k.
- In 2026, $12.62M of $14.02M came from individuals; PAC (other pol. cmte) $0.
HAYES, JAHANA
- In 2024, $2.97M of $4.22M came from individuals; PAC (other pol. cmte) $944k.
- In 2026, $826k of $1.72M came from individuals; PAC (other pol. cmte) $780k.
LARSON, JOHN B
- In 2024, $481k of $1.54M came from individuals; PAC (other pol. cmte) $1.04M.
- In 2026, $1.62M of $2.98M came from individuals; PAC (other pol. cmte) $1.34M.
Short talking points — money & predicted voting
Open with the model set’s statewide call: DEM favored at about 94% Dem win probability on public campaign-finance + roster features — not a poll. Then the money shape: Connecticut federal candidates look balanced in 2026 weball (about $4.54M PAC / $17.09M individual of $23.78M total). Spotlight MURPHY, CHRISTOPHER S for one concrete receipt picture. Close civic: these are public contribution patterns and a transparent forecast model call — not evidence of wrongdoing, and not a substitute for Cook or election-night counts.
DE — Delaware
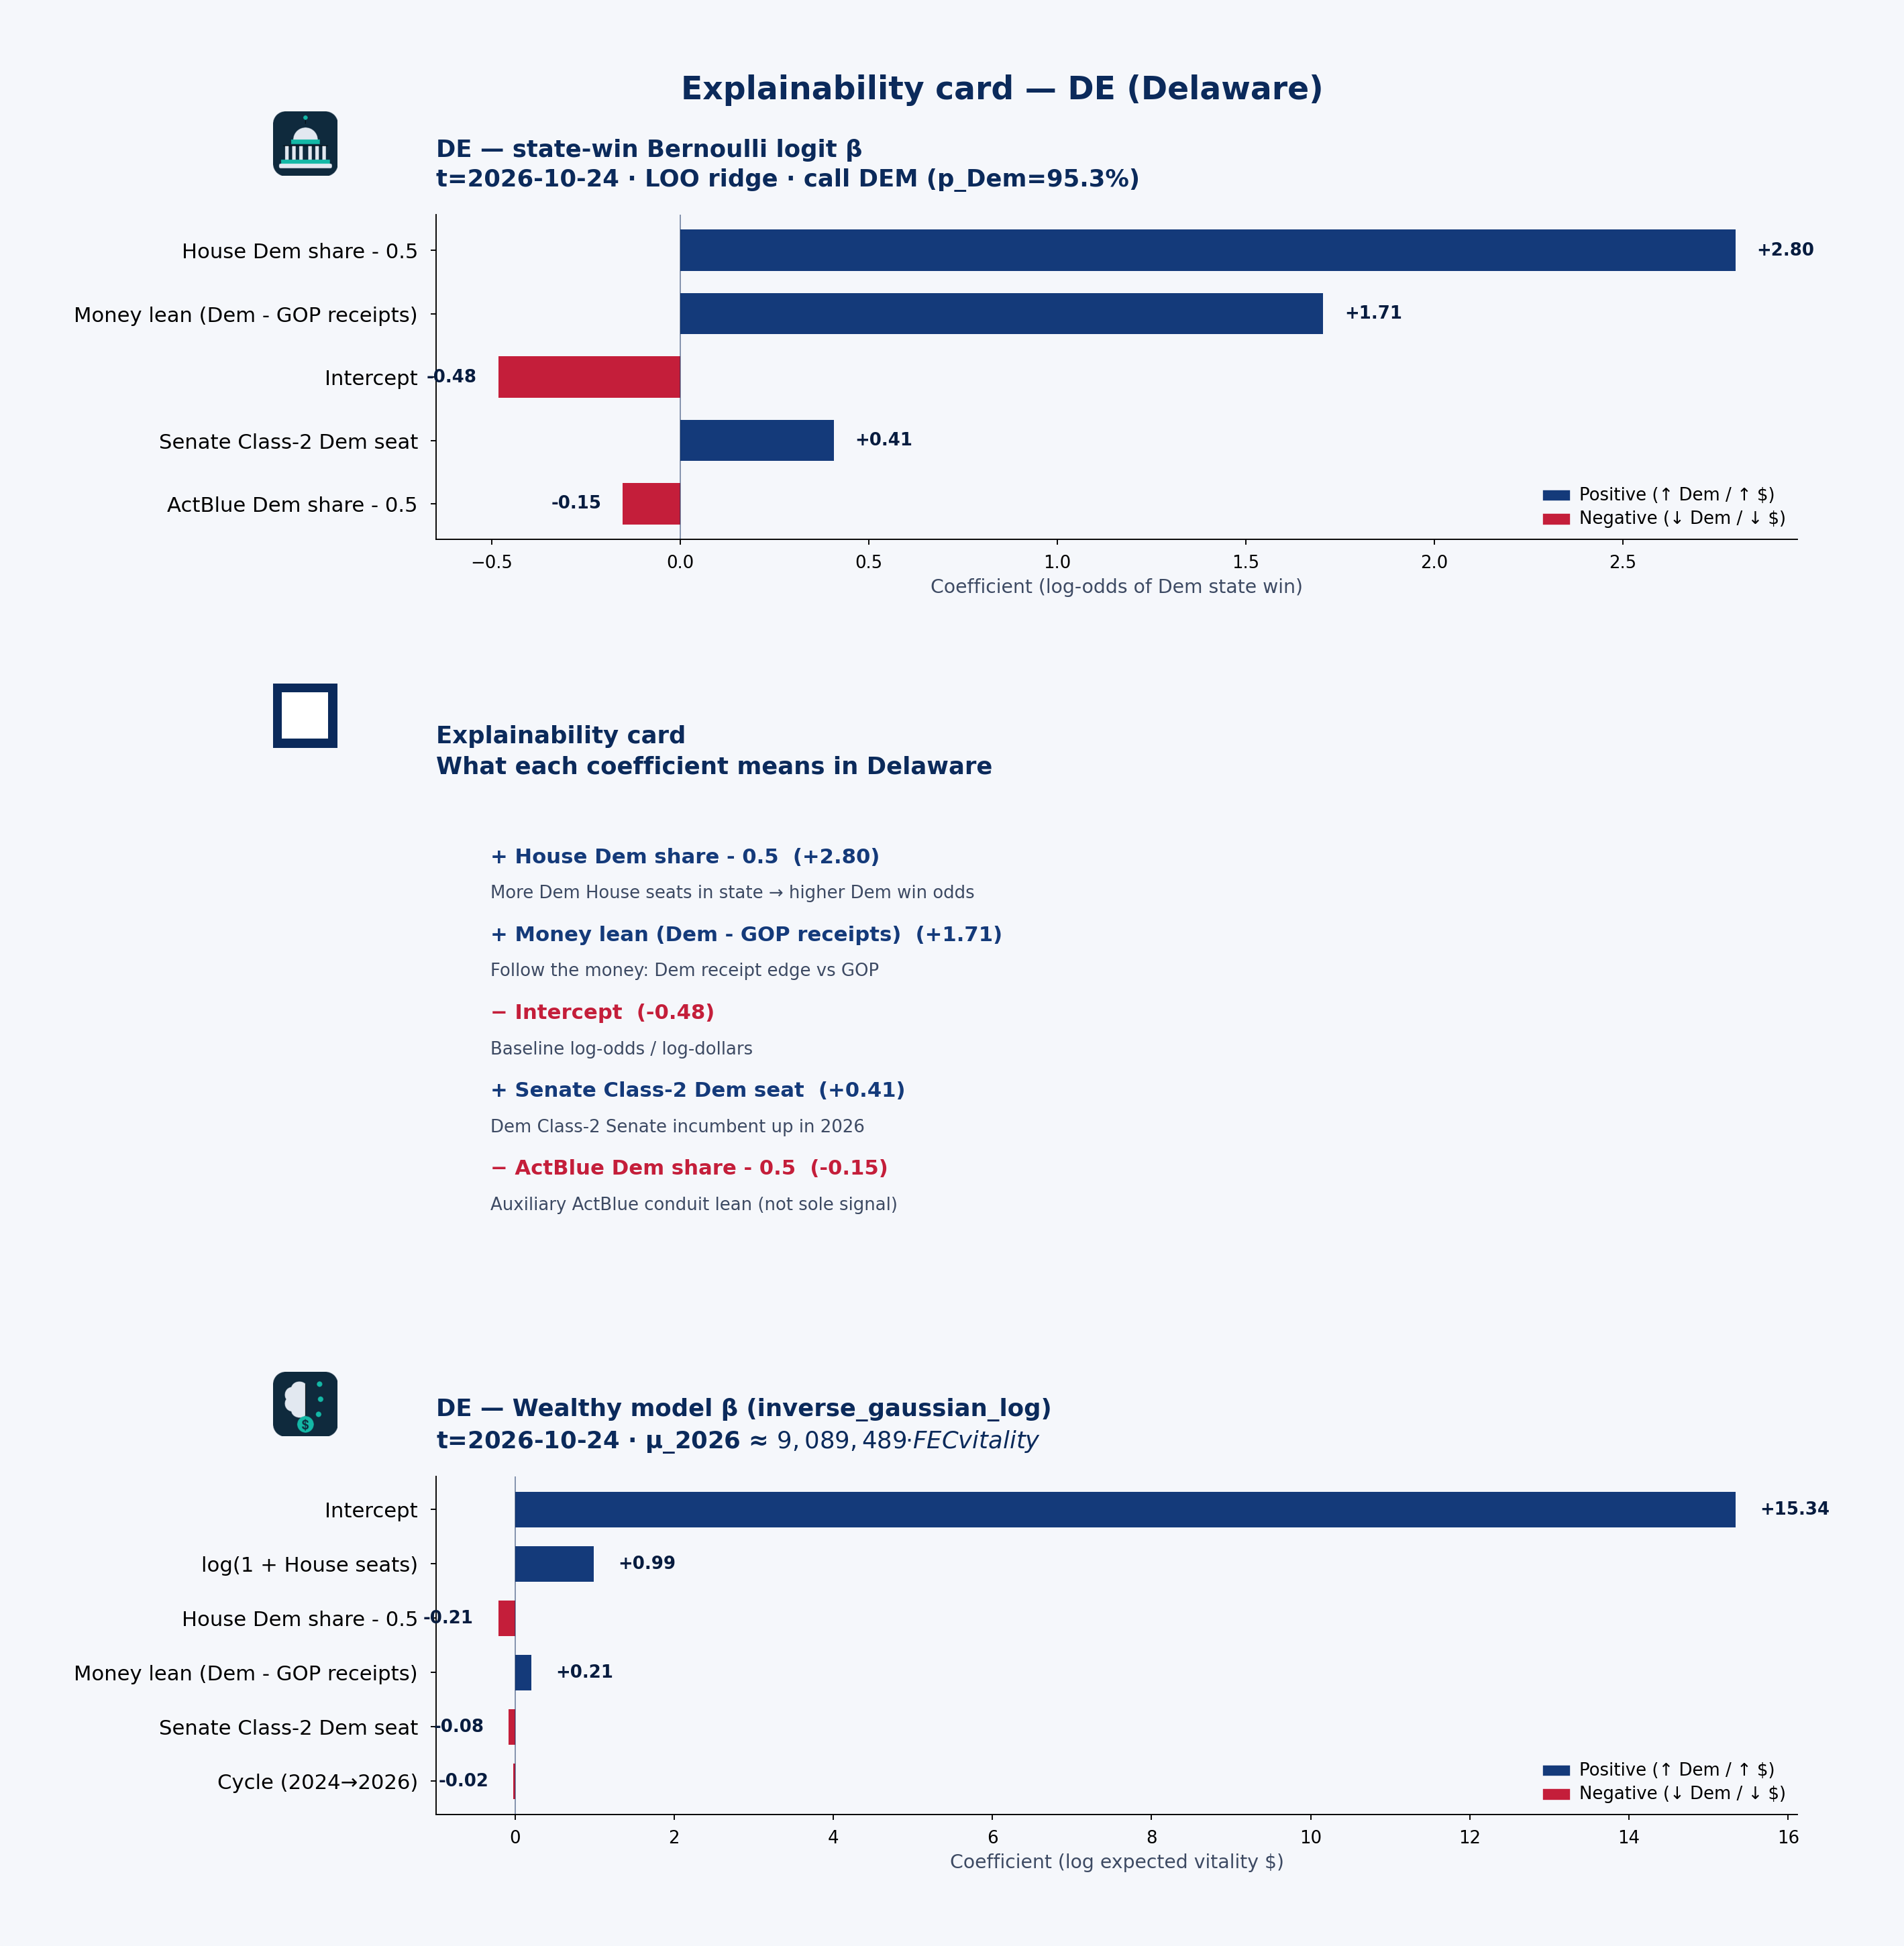 State explainability card · state-win LOO coefficient stability, plain language, and Wealthy model · DE · t=2026-10-24
Statewide call: DEM (p_Dem=95%) · 2026 money shape: balanced
Receipts by cycle (campaign-finance weball)
| Cycle | Candidate | Total receipts | Individual | PAC (other pol. cmte) |
|---|---|---|---|---|
| 2024 | BLUNT ROCHESTER, LISA | $9.93M | $6.04M | $2.37M |
| 2026 | BLUNT ROCHESTER, LISA | $1.23M | $666k | $354k |
| 2024 | COONS, CHRISTOPHER A. | $1.75M | $1.06M | $536k |
| 2026 | COONS, CHRISTOPHER A. | $4.96M | $2.21M | $1.64M |
| 2024 | MCBRIDE, SARAH ELIZABETH | $4.09M | $3.58M | $416k |
| 2026 | MCBRIDE, SARAH ELIZABETH | $5.56M | $4.73M | $577k |
PAC & individual money
PAC money was about $3.32M of $15.78M total receipts in 2024 and $2.57M of $11.74M in 2026. Direct committee→candidate 24K (non-memo) ran about $3.08M (2024) / $2.27M (2026). Itemized individual share from Delaware: 67.7% (2024) / 64.8% (2026).
BLUNT ROCHESTER, LISA: Cycle-to-date weball receipts ~$1.23M, with PAC direct 24K $2.12M → $325k vs 2024. the public campaign-finance data feed by-size individual totals are not loaded in this 50-state snapshot.
Spotlight candidates
BLUNT ROCHESTER, LISA
- In 2024, $6.04M of $9.93M came from individuals; PAC (other pol. cmte) $2.37M.
- In 2026, $666k of $1.23M came from individuals; PAC (other pol. cmte) $354k.
MCBRIDE, SARAH ELIZABETH
- In 2024, $3.58M of $4.09M came from individuals; PAC (other pol. cmte) $416k.
- In 2026, $4.73M of $5.56M came from individuals; PAC (other pol. cmte) $577k.
COONS, CHRISTOPHER A.
- In 2024, $1.06M of $1.75M came from individuals; PAC (other pol. cmte) $536k.
- In 2026, $2.21M of $4.96M came from individuals; PAC (other pol. cmte) $1.64M.
Short talking points — money & predicted voting
Open with the model set’s statewide call: DEM favored at about 95% Dem win probability on public campaign-finance + roster features — not a poll. Then the money shape: Delaware federal candidates look balanced in 2026 weball (about $2.57M PAC / $7.61M individual of $11.74M total). Spotlight BLUNT ROCHESTER, LISA for one concrete receipt picture. Close civic: these are public contribution patterns and a transparent forecast model call — not evidence of wrongdoing, and not a substitute for Cook or election-night counts.
FL — Florida
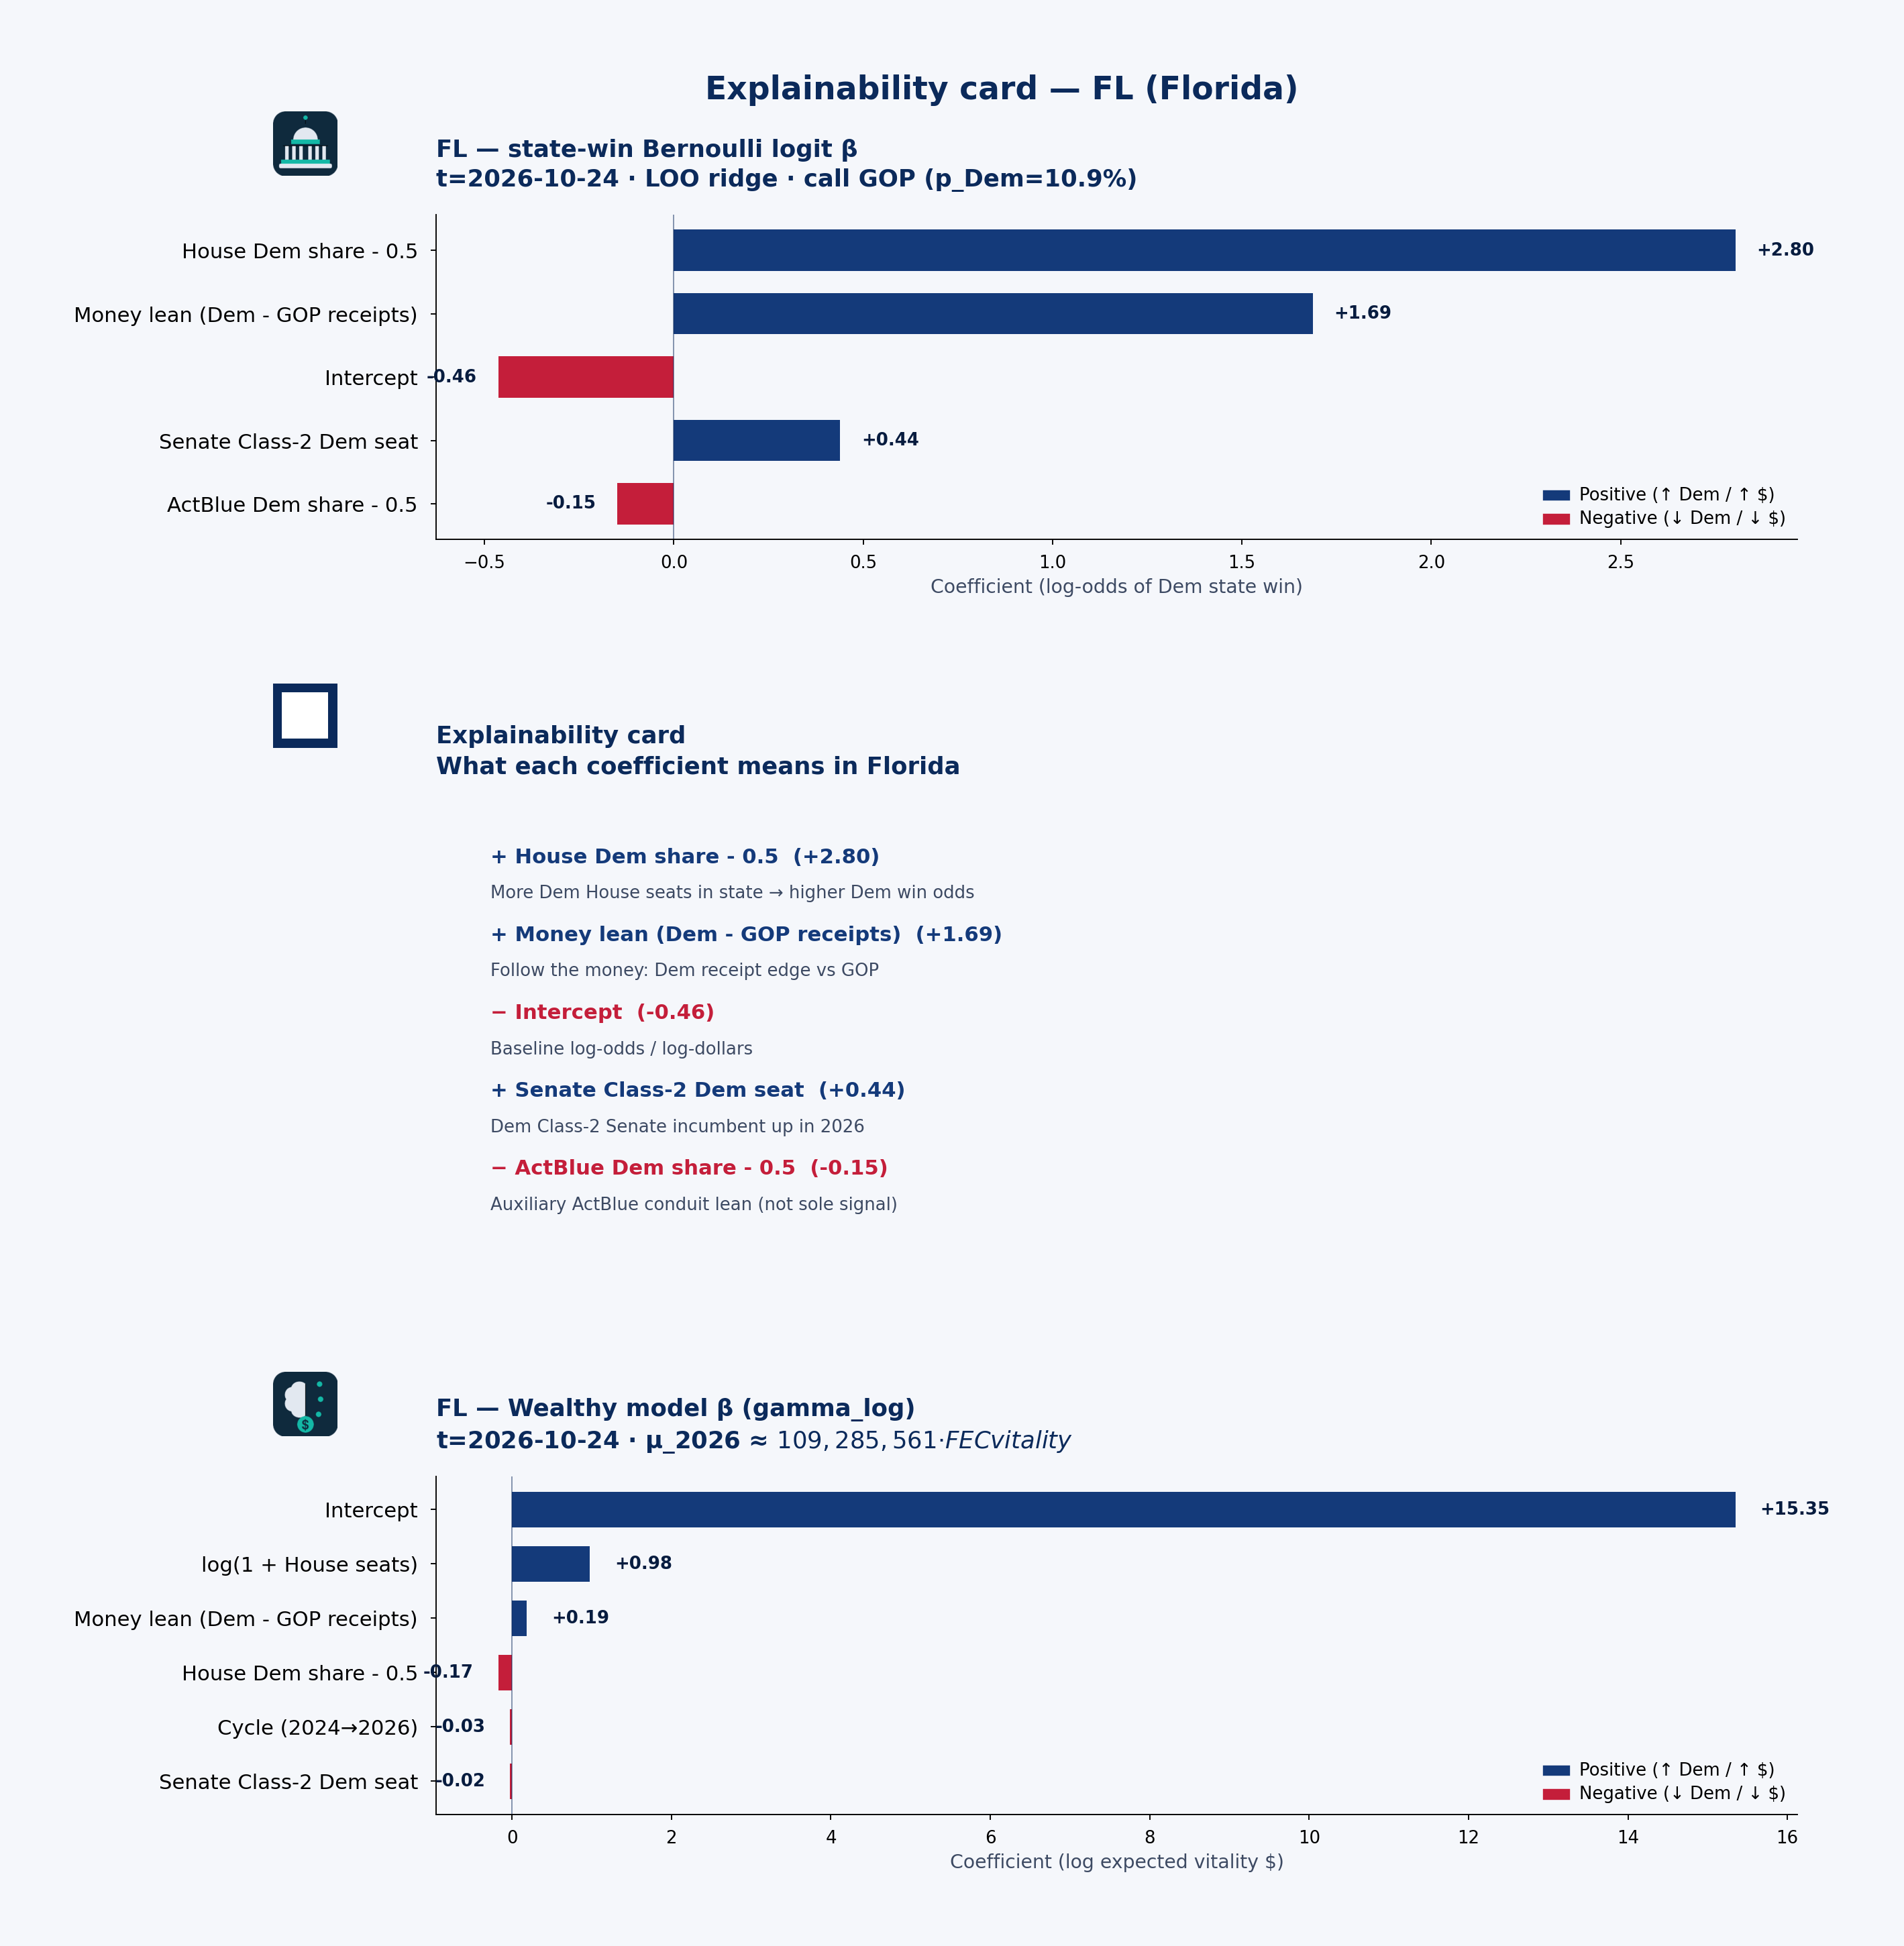 State explainability card · state-win LOO coefficient stability, plain language, and Wealthy model · FL · t=2026-10-24
Statewide call: GOP (p_Dem=11%) · 2026 money shape: individual-heavy
Receipts by cycle (campaign-finance weball)
| Cycle | Candidate | Total receipts | Individual | PAC (other pol. cmte) |
|---|---|---|---|---|
| 2024 | GROSS, KEITH | $2.62M | $49k | $0 |
| 2024 | GROSS, KEITH | $2.62M | $49k | $0 |
| 2026 | GROSS, KEITH | $12.34M | $98k | $7k |
| 2026 | GROSS, KEITH | $12.34M | $98k | $7k |
| 2026 | MOODY, ASHLEY | $14.52M | $6.83M | $2.40M |
| 2024 | MUCARSEL-POWELL, DEBBIE | $36.62M | $34.48M | $806k |
| 2024 | SCOTT, RICK SEN | $36.70M | $5.56M | $991k |
| 2026 | SCOTT, RICK SEN | $1.82M | $423k | $109k |
| 2026 | VINDMAN, ALEXANDER | $20.49M | $17.34M | $217k |
| 2026 | WEIL, JOSHUA JOSEPH | $15.93M | $15.46M | $34k |
| 2026 | WEIL, JOSHUA JOSEPH | $15.93M | $15.46M | $34k |
PAC & individual money
PAC money was about $20.63M of $175.98M total receipts in 2024 and $26.01M of $297.59M in 2026. Direct committee→candidate 24K (non-memo) ran about $21.78M (2024) / $21.12M (2026). Itemized individual share from Florida: 56.5% (2024) / 52.2% (2026).
SCOTT, RICK SEN: Cycle-to-date weball receipts ~$1.82M, with PAC direct 24K $1.46M → $108k vs 2024. the public campaign-finance data feed by-size individual totals are not loaded in this 50-state snapshot.
Spotlight candidates
SCOTT, RICK SEN
- In 2024, $5.56M of $36.70M came from individuals; PAC (other pol. cmte) $991k.
- In 2026, $423k of $1.82M came from individuals; PAC (other pol. cmte) $109k.
MUCARSEL-POWELL, DEBBIE
- In 2024, $34.48M of $36.62M came from individuals; PAC (other pol. cmte) $806k.
VINDMAN, ALEXANDER
- In 2026, $17.34M of $20.49M came from individuals; PAC (other pol. cmte) $217k.
Short talking points — money & predicted voting
Open with the model set’s statewide call: GOP favored at about 11% Dem win probability on public campaign-finance + roster features — not a poll. Then the money shape: Florida federal candidates look individual-heavy in 2026 weball (about $26.01M PAC / $155.49M individual of $297.59M total). Spotlight SCOTT, RICK SEN for one concrete receipt picture. Close civic: these are public contribution patterns and a transparent forecast model call — not evidence of wrongdoing, and not a substitute for Cook or election-night counts.
GA — Georgia
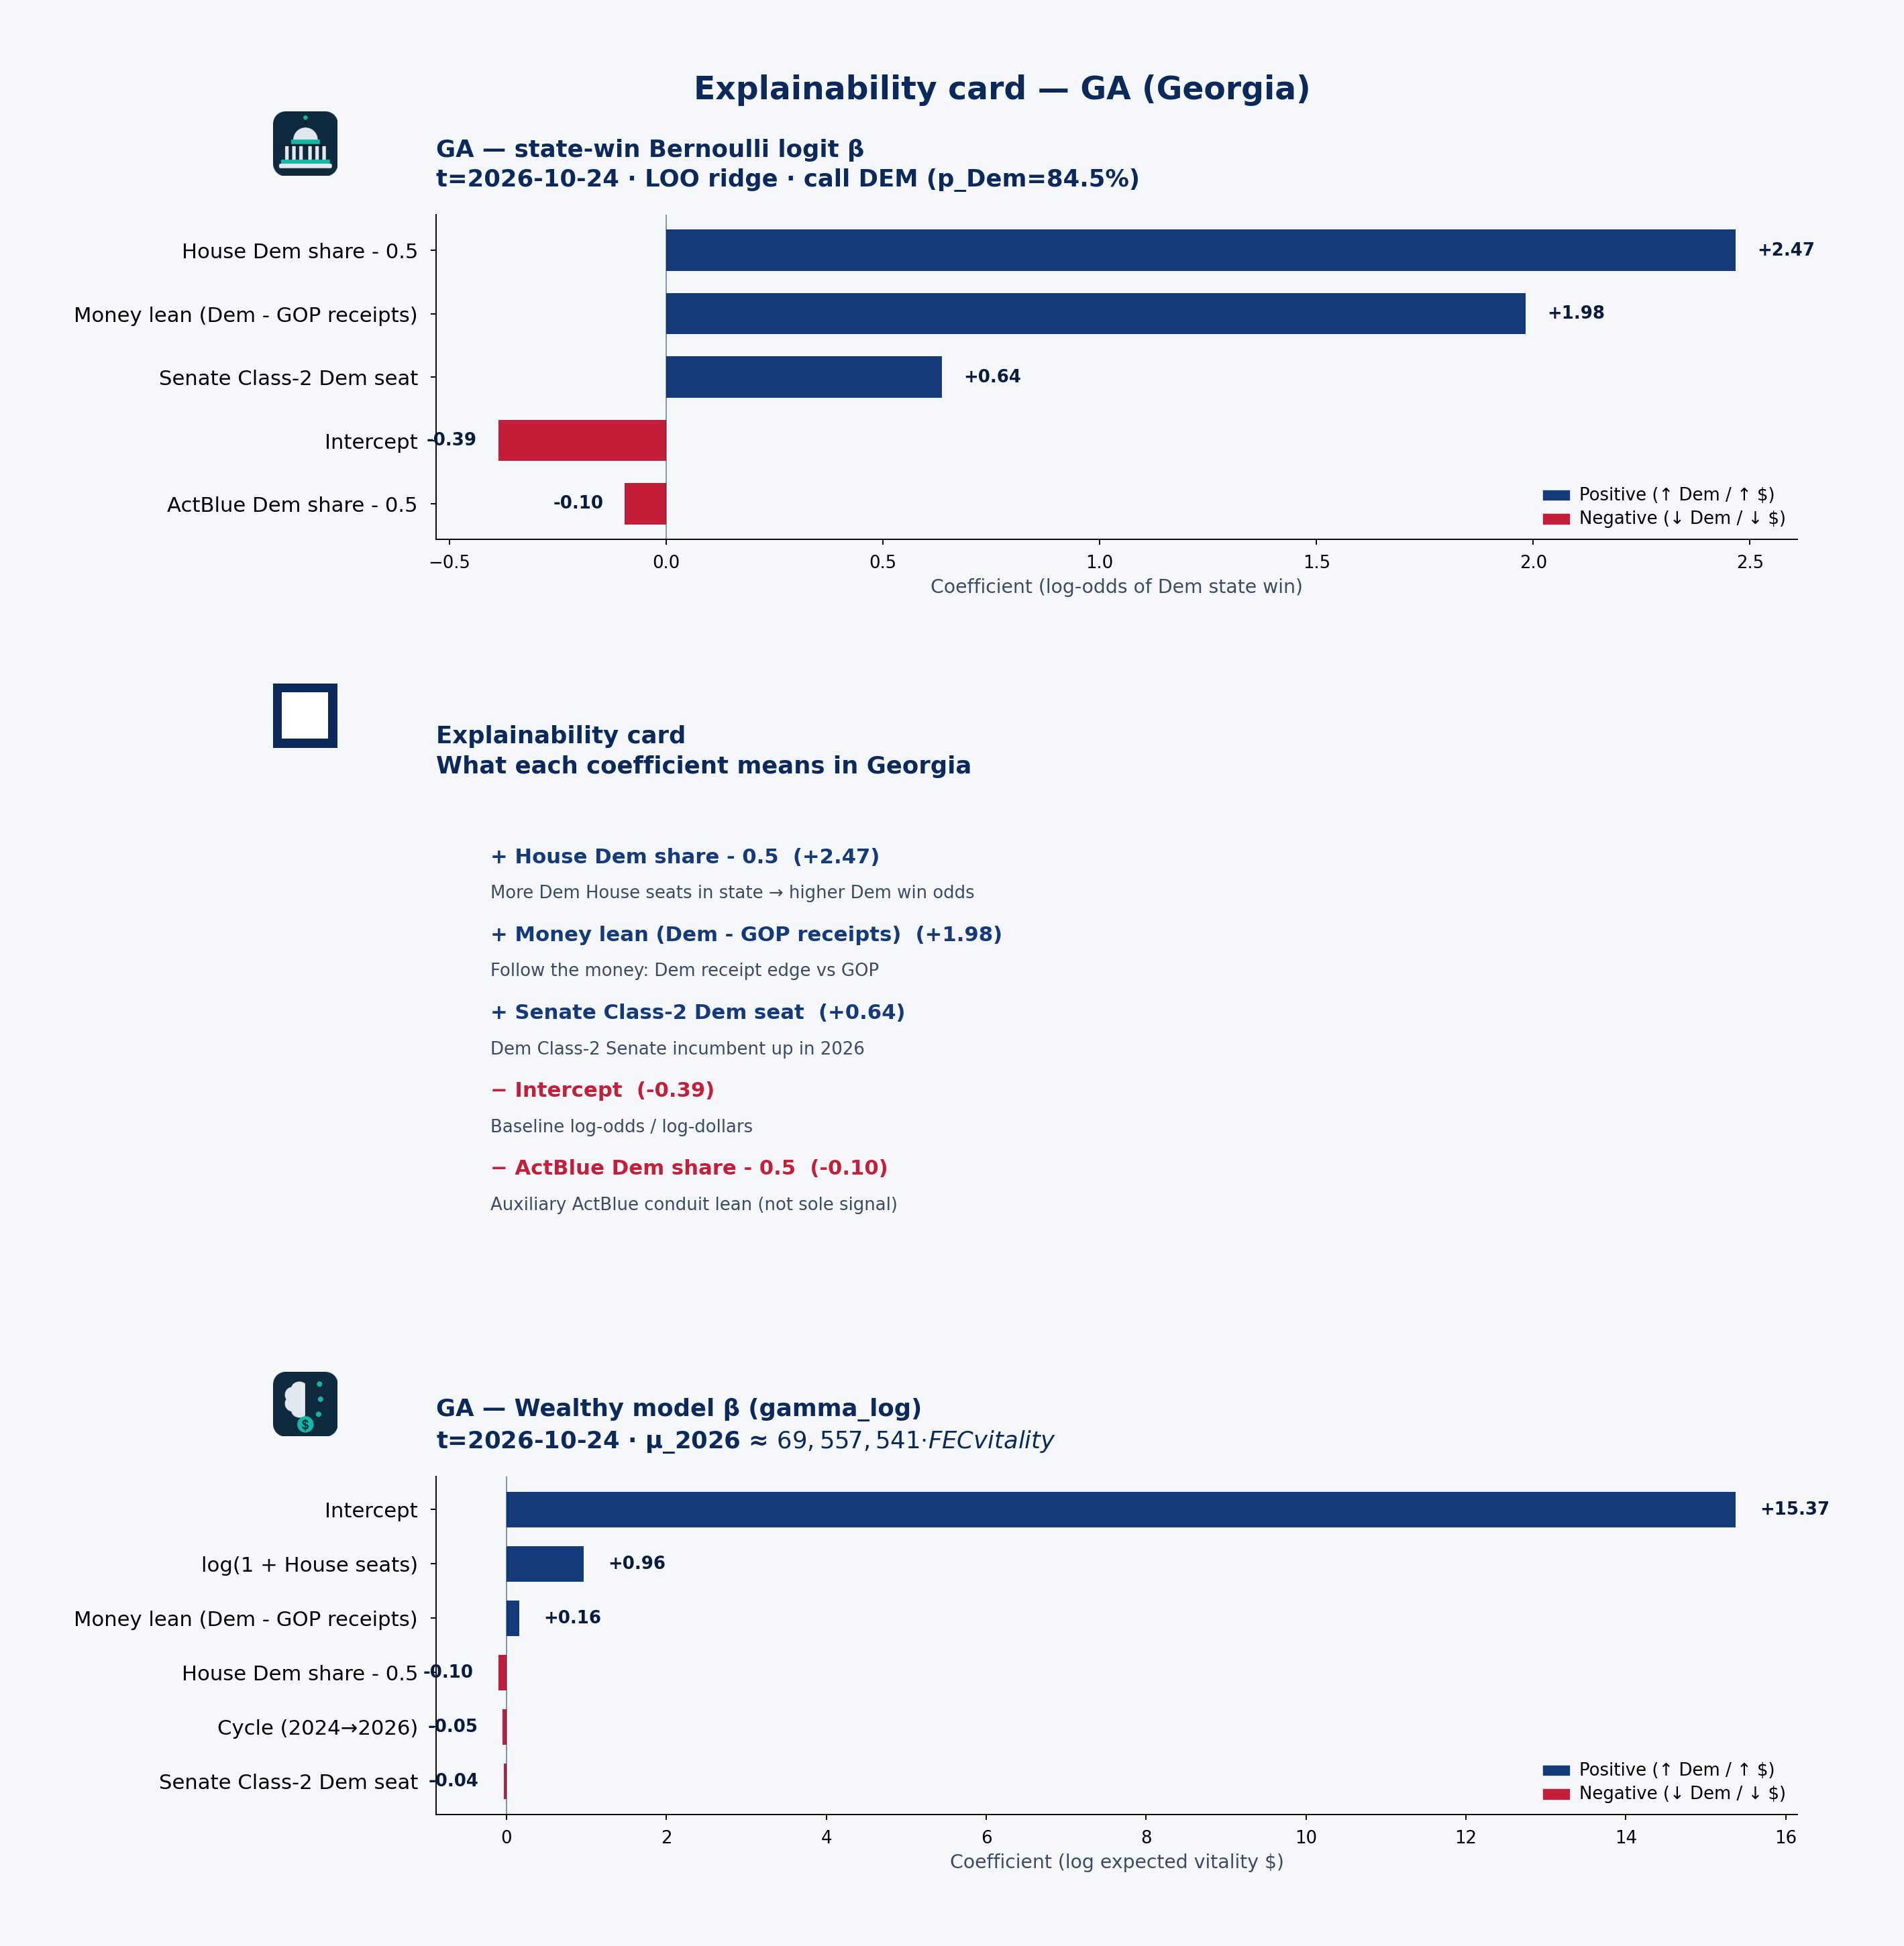 State explainability card · state-win LOO coefficient stability, plain language, and Wealthy model · GA · t=2026-10-24
Statewide call: DEM (p_Dem=85%) · 2026 money shape: individual-heavy
Receipts by cycle (campaign-finance weball)
| Cycle | Candidate | Total receipts | Individual | PAC (other pol. cmte) |
|---|---|---|---|---|
| 2024 | CARTER, EARL LEROY | $2.60M | $719k | $1.58M |
| 2026 | CARTER, EARL LEROY | $7.32M | $1.94M | $1.11M |
| 2026 | CARTER, EARL LEROY | $7.32M | $1.94M | $1.11M |
| 2024 | COLLINS, MICHAEL A JR | $1.71M | $1.23M | $371k |
| 2026 | COLLINS, MICHAEL A JR | $9.71M | $6.16M | $676k |
| 2026 | COLLINS, MICHAEL A JR | $10.68M | $7.07M | $676k |
| 2024 | GREENE, MARJORIE TAYLOR | $8.96M | $8.83M | $35k |
| 2024 | HARRIS, SHAWN | $3.53M | $3.50M | $33k |
| 2026 | HARRIS, SHAWN | $8.42M | $8.40M | $14k |
| 2024 | OSSOFF, T. JONATHAN | $7.20M | $6.80M | $4k |
| 2026 | OSSOFF, T. JONATHAN | $115.90M | $102.23M | $1.09M |
| 2024 | WARNOCK, RAPHAEL | $4.82M | $3.79M | $87k |
| 2026 | WARNOCK, RAPHAEL | $3.56M | $3.35M | $92k |
PAC & individual money
PAC money was about $10.04M of $50.39M total receipts in 2024 and $12.76M of $202.60M in 2026. Direct committee→candidate 24K (non-memo) ran about $10.44M (2024) / $9.82M (2026). Itemized individual share from Georgia: 68.7% (2024) / 74.9% (2026).
OSSOFF, T. JONATHAN: Cycle-to-date weball receipts ~$115.90M, with PAC direct 24K $25k → $1.03M vs 2024. the public campaign-finance data feed by-size individual totals are not loaded in this 50-state snapshot.
Spotlight candidates
OSSOFF, T. JONATHAN
- In 2024, $6.80M of $7.20M came from individuals; PAC (other pol. cmte) $4k.
- In 2026, $102.23M of $115.90M came from individuals; PAC (other pol. cmte) $1.09M.
COLLINS, MICHAEL A JR
- In 2026, $7.07M of $10.68M came from individuals; PAC (other pol. cmte) $676k.
COLLINS, MICHAEL A JR
- In 2024, $1.23M of $1.71M came from individuals; PAC (other pol. cmte) $371k.
- In 2026, $6.16M of $9.71M came from individuals; PAC (other pol. cmte) $676k.
Short talking points — money & predicted voting
Open with the model set’s statewide call: DEM favored at about 85% Dem win probability on public campaign-finance + roster features — not a poll. Then the money shape: Georgia federal candidates look individual-heavy in 2026 weball (about $12.76M PAC / $151.67M individual of $202.60M total). Spotlight OSSOFF, T. JONATHAN for one concrete receipt picture. Close civic: these are public contribution patterns and a transparent forecast model call — not evidence of wrongdoing, and not a substitute for Cook or election-night counts.
HI — Hawaii
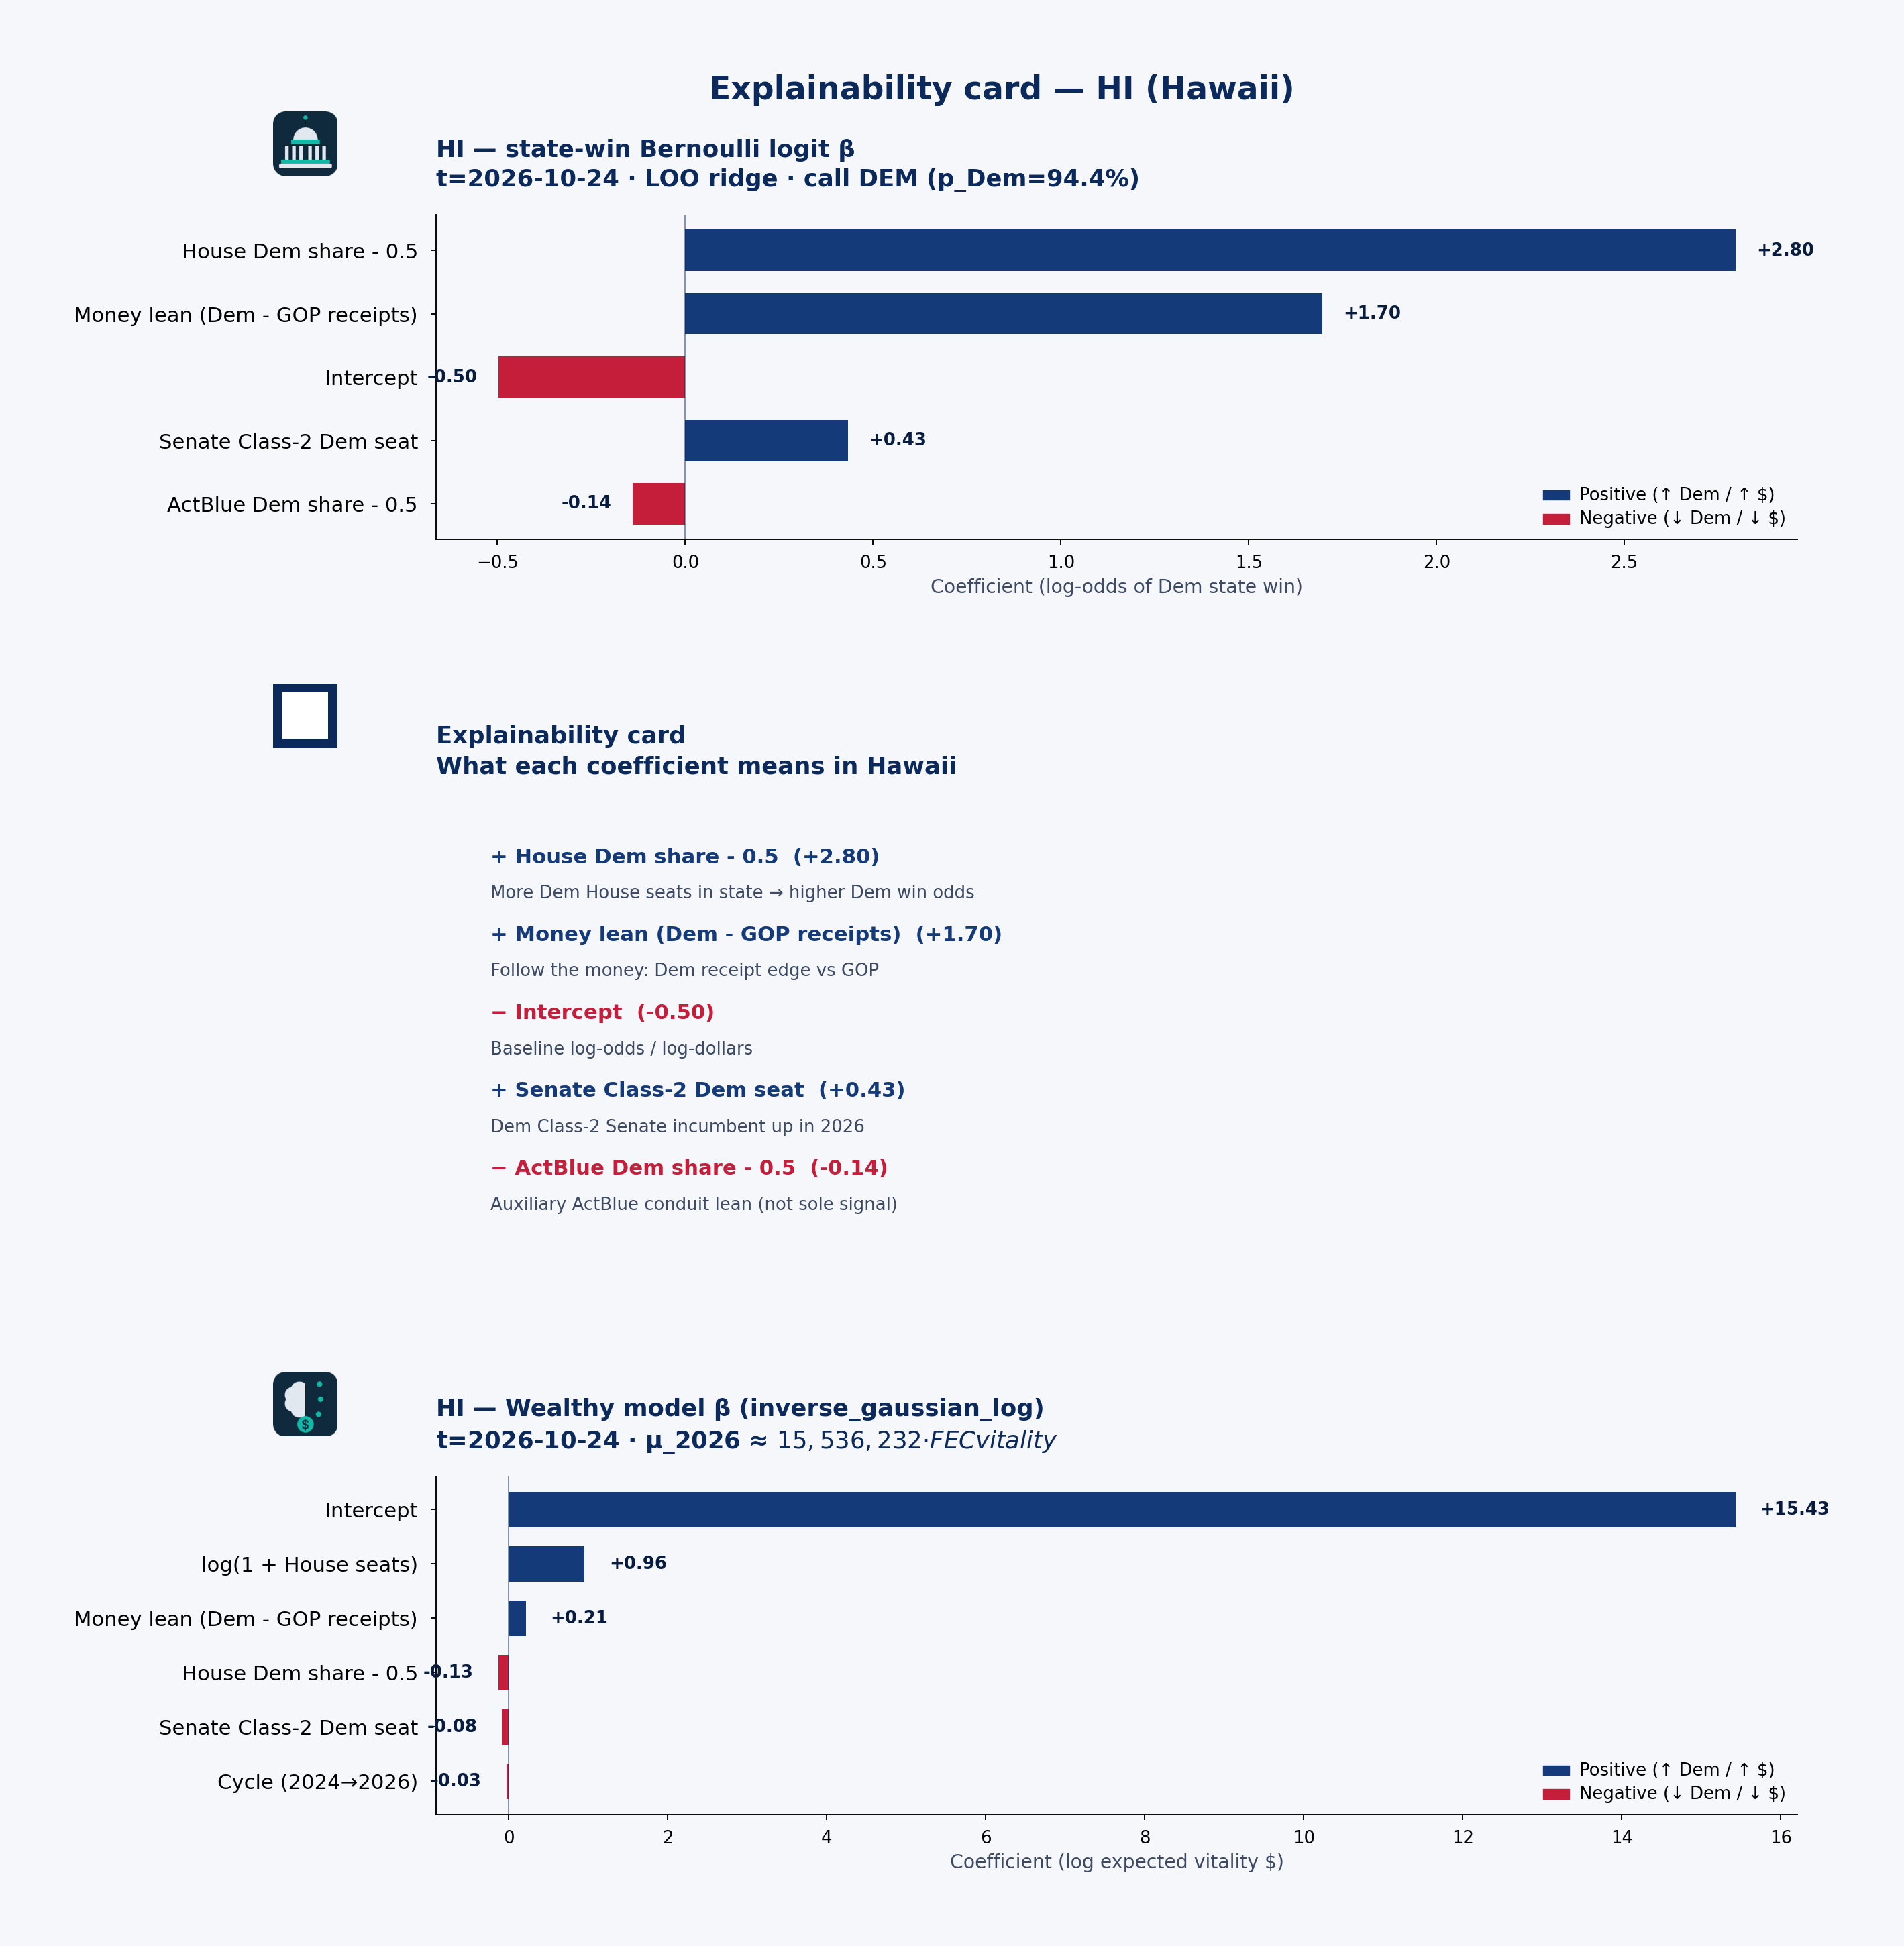 State explainability card · state-win LOO coefficient stability, plain language, and Wealthy model · HI · t=2026-10-24
Statewide call: DEM (p_Dem=94%) · 2026 money shape: balanced
Receipts by cycle (campaign-finance weball)
| Cycle | Candidate | Total receipts | Individual | PAC (other pol. cmte) |
|---|---|---|---|---|
| 2024 | CASE, EDWARD | $700k | $153k | $547k |
| 2026 | CASE, EDWARD | $1.34M | $700k | $639k |
| 2024 | HIRONO, MAZIE K. | $3.29M | $2.06M | $1.09M |
| 2026 | HIRONO, MAZIE K. | $617k | $548k | $54k |
| 2024 | SCHATZ, BRIAN | $525k | $319k | $127k |
| 2026 | SCHATZ, BRIAN | $1.79M | $1.23M | $455k |
| 2024 | TOKUDA, JILL NAOMI | $989k | $663k | $317k |
| 2026 | TOKUDA, JILL NAOMI | $986k | $734k | $244k |
PAC & individual money
PAC money was about $2.08M of $5.51M total receipts in 2024 and $1.39M of $4.74M in 2026. Direct committee→candidate 24K (non-memo) ran about $2.01M (2024) / $1.19M (2026). Itemized individual share from Hawaii: 58.1% (2024) / 67.8% (2026).
HIRONO, MAZIE K.: Cycle-to-date weball receipts ~$617k, with PAC direct 24K $1.06M → $52k vs 2024. the public campaign-finance data feed by-size individual totals are not loaded in this 50-state snapshot.
Spotlight candidates
HIRONO, MAZIE K.
- In 2024, $2.06M of $3.29M came from individuals; PAC (other pol. cmte) $1.09M.
- In 2026, $548k of $617k came from individuals; PAC (other pol. cmte) $54k.
SCHATZ, BRIAN
- In 2024, $319k of $525k came from individuals; PAC (other pol. cmte) $127k.
- In 2026, $1.23M of $1.79M came from individuals; PAC (other pol. cmte) $455k.
CASE, EDWARD
- In 2024, $153k of $700k came from individuals; PAC (other pol. cmte) $547k.
- In 2026, $700k of $1.34M came from individuals; PAC (other pol. cmte) $639k.
Short talking points — money & predicted voting
Open with the model set’s statewide call: DEM favored at about 94% Dem win probability on public campaign-finance + roster features — not a poll. Then the money shape: Hawaii federal candidates look balanced in 2026 weball (about $1.39M PAC / $3.21M individual of $4.74M total). Spotlight HIRONO, MAZIE K. for one concrete receipt picture. Close civic: these are public contribution patterns and a transparent forecast model call — not evidence of wrongdoing, and not a substitute for Cook or election-night counts.
IA — Iowa
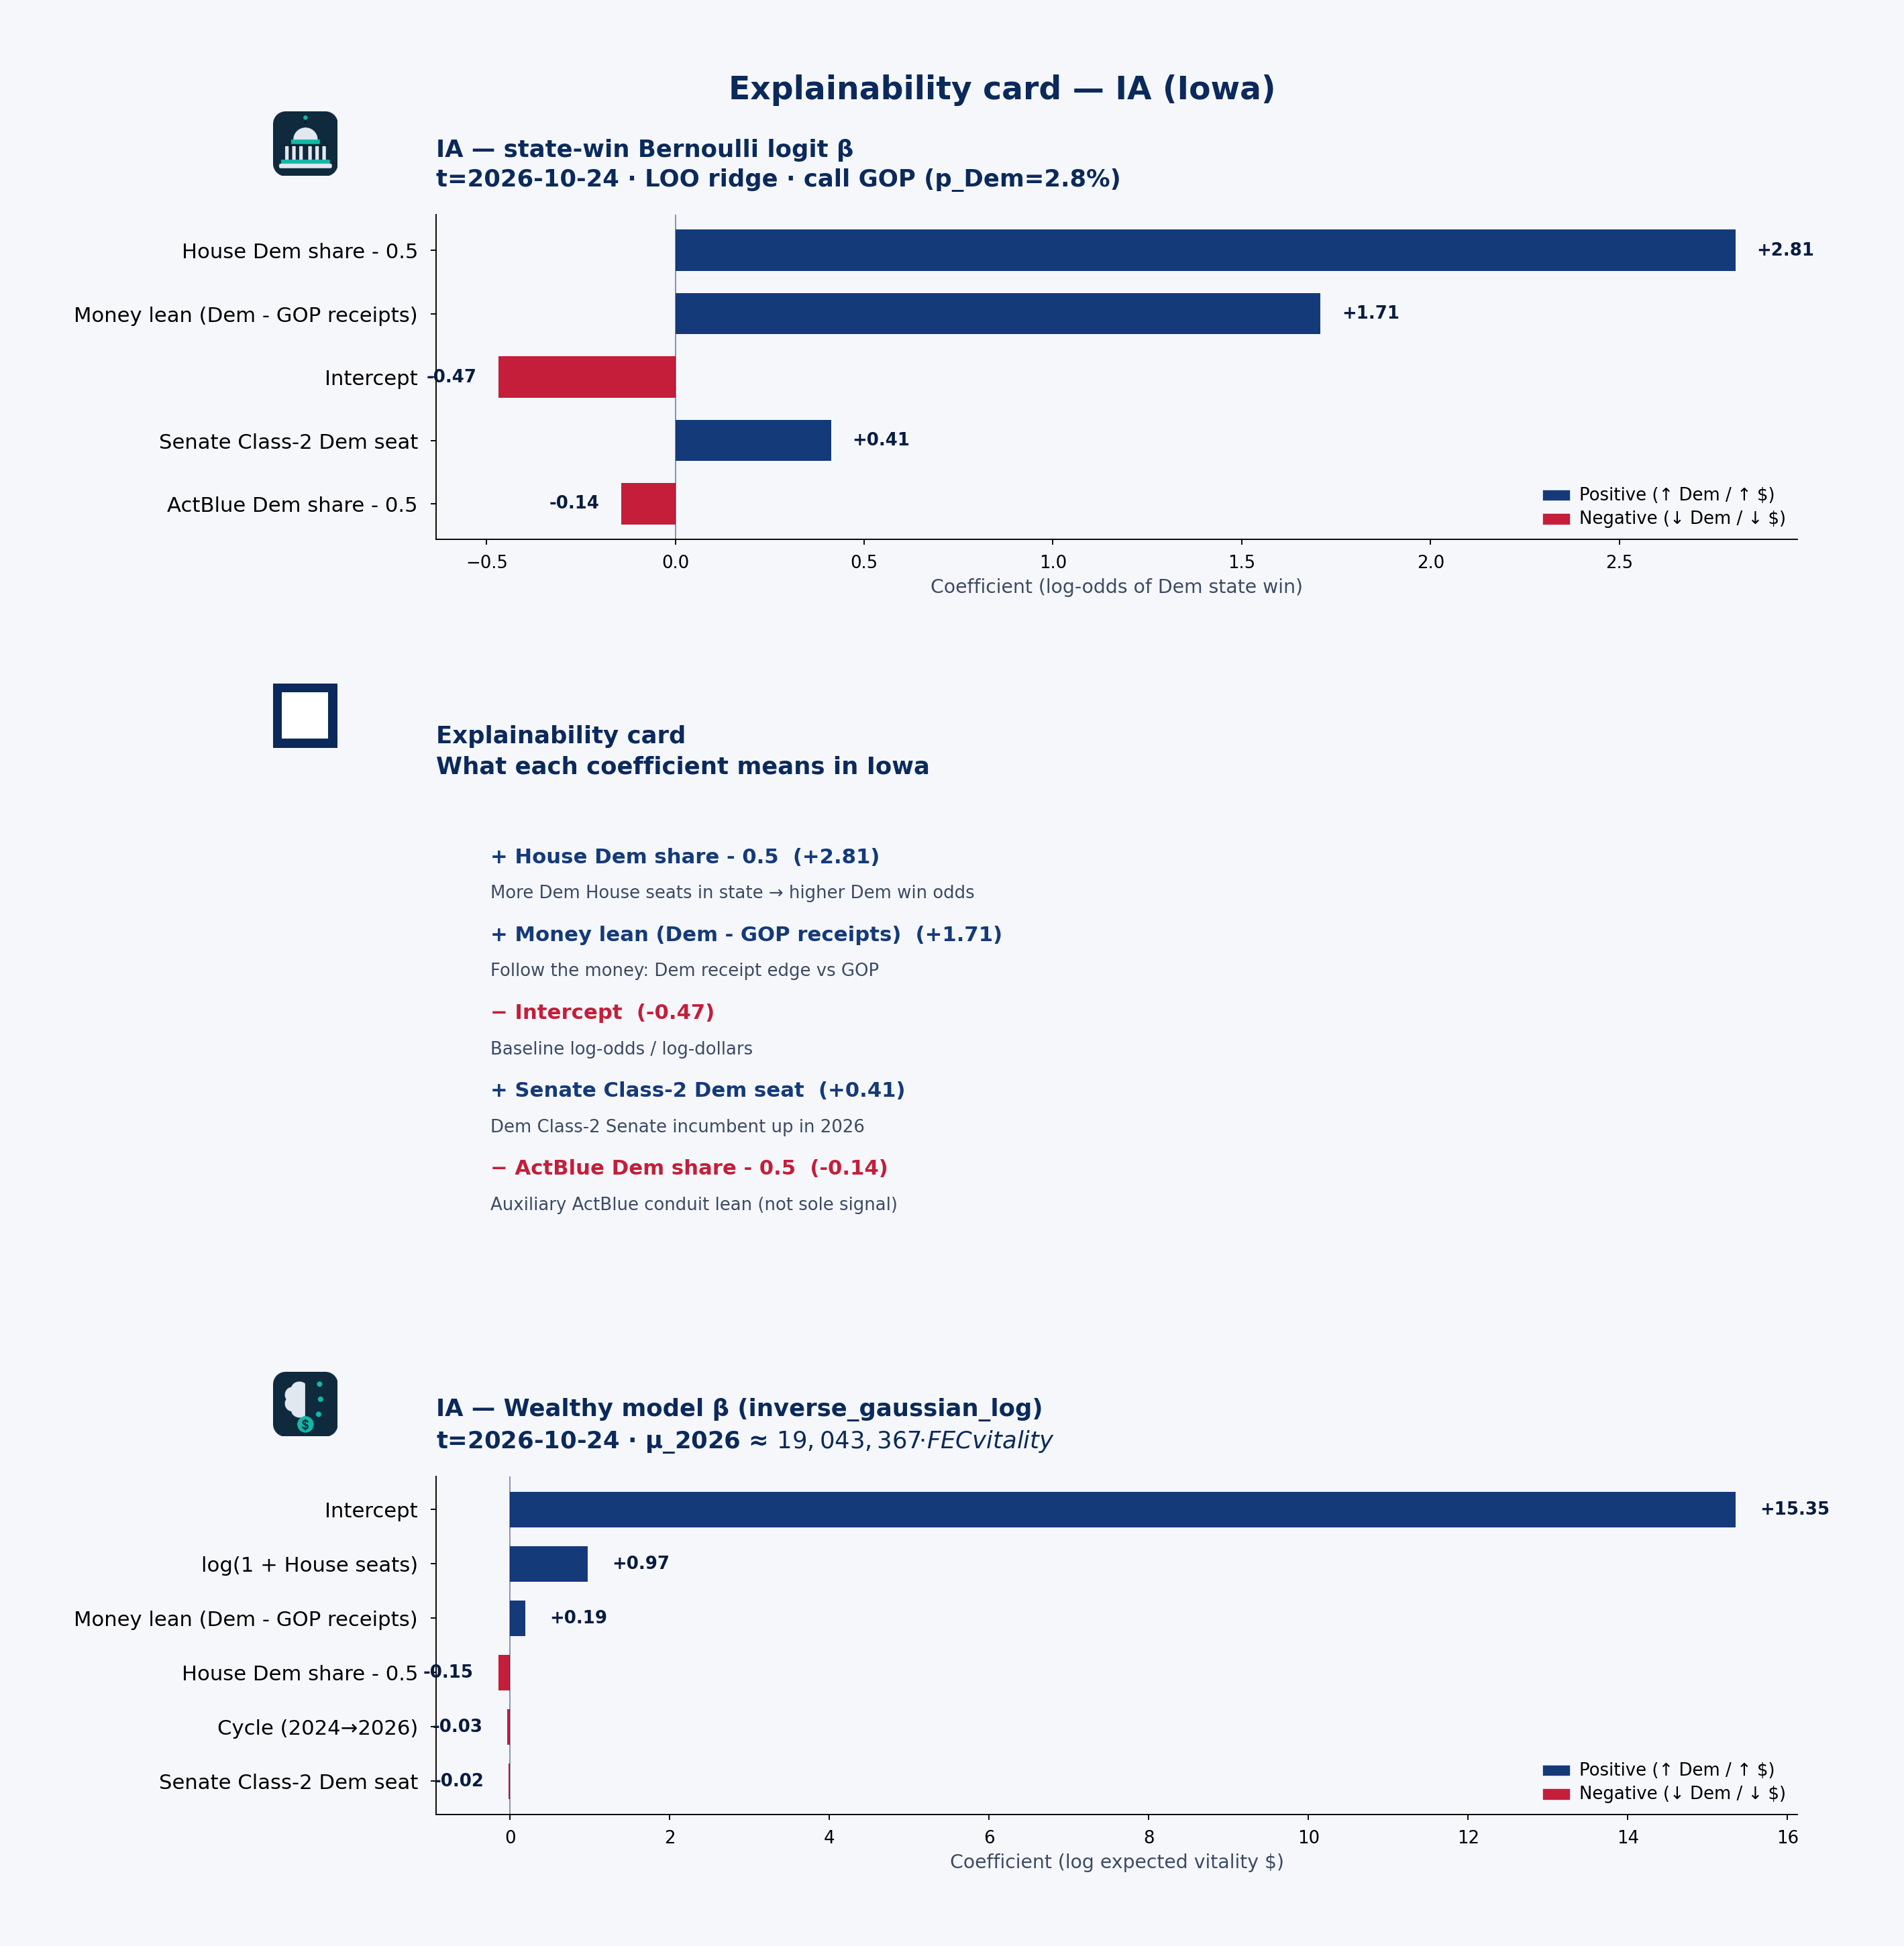 State explainability card · state-win LOO coefficient stability, plain language, and Wealthy model · IA · t=2026-10-24
Statewide call: GOP (p_Dem=3%) · 2026 money shape: balanced
Receipts by cycle (campaign-finance weball)
| Cycle | Candidate | Total receipts | Individual | PAC (other pol. cmte) |
|---|---|---|---|---|
| 2024 | ARENHOLZ, ASHLEY HINSON | $5.60M | $3.25M | $1.52M |
| 2026 | ARENHOLZ, ASHLEY HINSON | $14.15M | $7.51M | $2.66M |
| 2024 | ERNST, JONI K | $2.92M | $2.02M | $696k |
| 2026 | ERNST, JONI K | $2.01M | $997k | $637k |
| 2024 | FEENSTRA, RANDALL | $4.30M | $2.09M | $1.97M |
| 2026 | FEENSTRA, RANDALL | $1.12M | $306k | $597k |
| 2024 | GRASSLEY, CHARLES E | $770k | $483k | $109k |
| 2026 | GRASSLEY, CHARLES E | $528k | $291k | $72k |
| 2024 | MILLER-MEEKS, MARIANNETTE JANE | $5.80M | $2.23M | $2.34M |
| 2026 | MILLER-MEEKS, MARIANNETTE JANE | $9.10M | $4.17M | $2.86M |
| 2024 | NUNN, ZACH | $5.81M | $2.78M | $2.10M |
| 2026 | NUNN, ZACH | $6.12M | $1.42M | $2.18M |
PAC & individual money
PAC money was about $8.74M of $25.20M total receipts in 2024 and $9.01M of $33.03M in 2026. Direct committee→candidate 24K (non-memo) ran about $8.89M (2024) / $6.68M (2026). Itemized individual share from Iowa: 51.0% (2024) / 44.5% (2026).
ARENHOLZ, ASHLEY HINSON: Cycle-to-date weball receipts ~$14.15M, with PAC direct 24K $1.50M → $1.00M vs 2024. the public campaign-finance data feed by-size individual totals are not loaded in this 50-state snapshot.
Spotlight candidates
ARENHOLZ, ASHLEY HINSON
- In 2024, $3.25M of $5.60M came from individuals; PAC (other pol. cmte) $1.52M.
- In 2026, $7.51M of $14.15M came from individuals; PAC (other pol. cmte) $2.66M.
MILLER-MEEKS, MARIANNETTE JANE
- In 2024, $2.23M of $5.80M came from individuals; PAC (other pol. cmte) $2.34M.
- In 2026, $4.17M of $9.10M came from individuals; PAC (other pol. cmte) $2.86M.
NUNN, ZACH
- In 2024, $2.78M of $5.81M came from individuals; PAC (other pol. cmte) $2.10M.
- In 2026, $1.42M of $6.12M came from individuals; PAC (other pol. cmte) $2.18M.
Short talking points — money & predicted voting
Open with the model set’s statewide call: GOP favored at about 3% Dem win probability on public campaign-finance + roster features — not a poll. Then the money shape: Iowa federal candidates look balanced in 2026 weball (about $9.01M PAC / $14.70M individual of $33.03M total). Spotlight ARENHOLZ, ASHLEY HINSON for one concrete receipt picture. Close civic: these are public contribution patterns and a transparent forecast model call — not evidence of wrongdoing, and not a substitute for Cook or election-night counts.
ID — Idaho
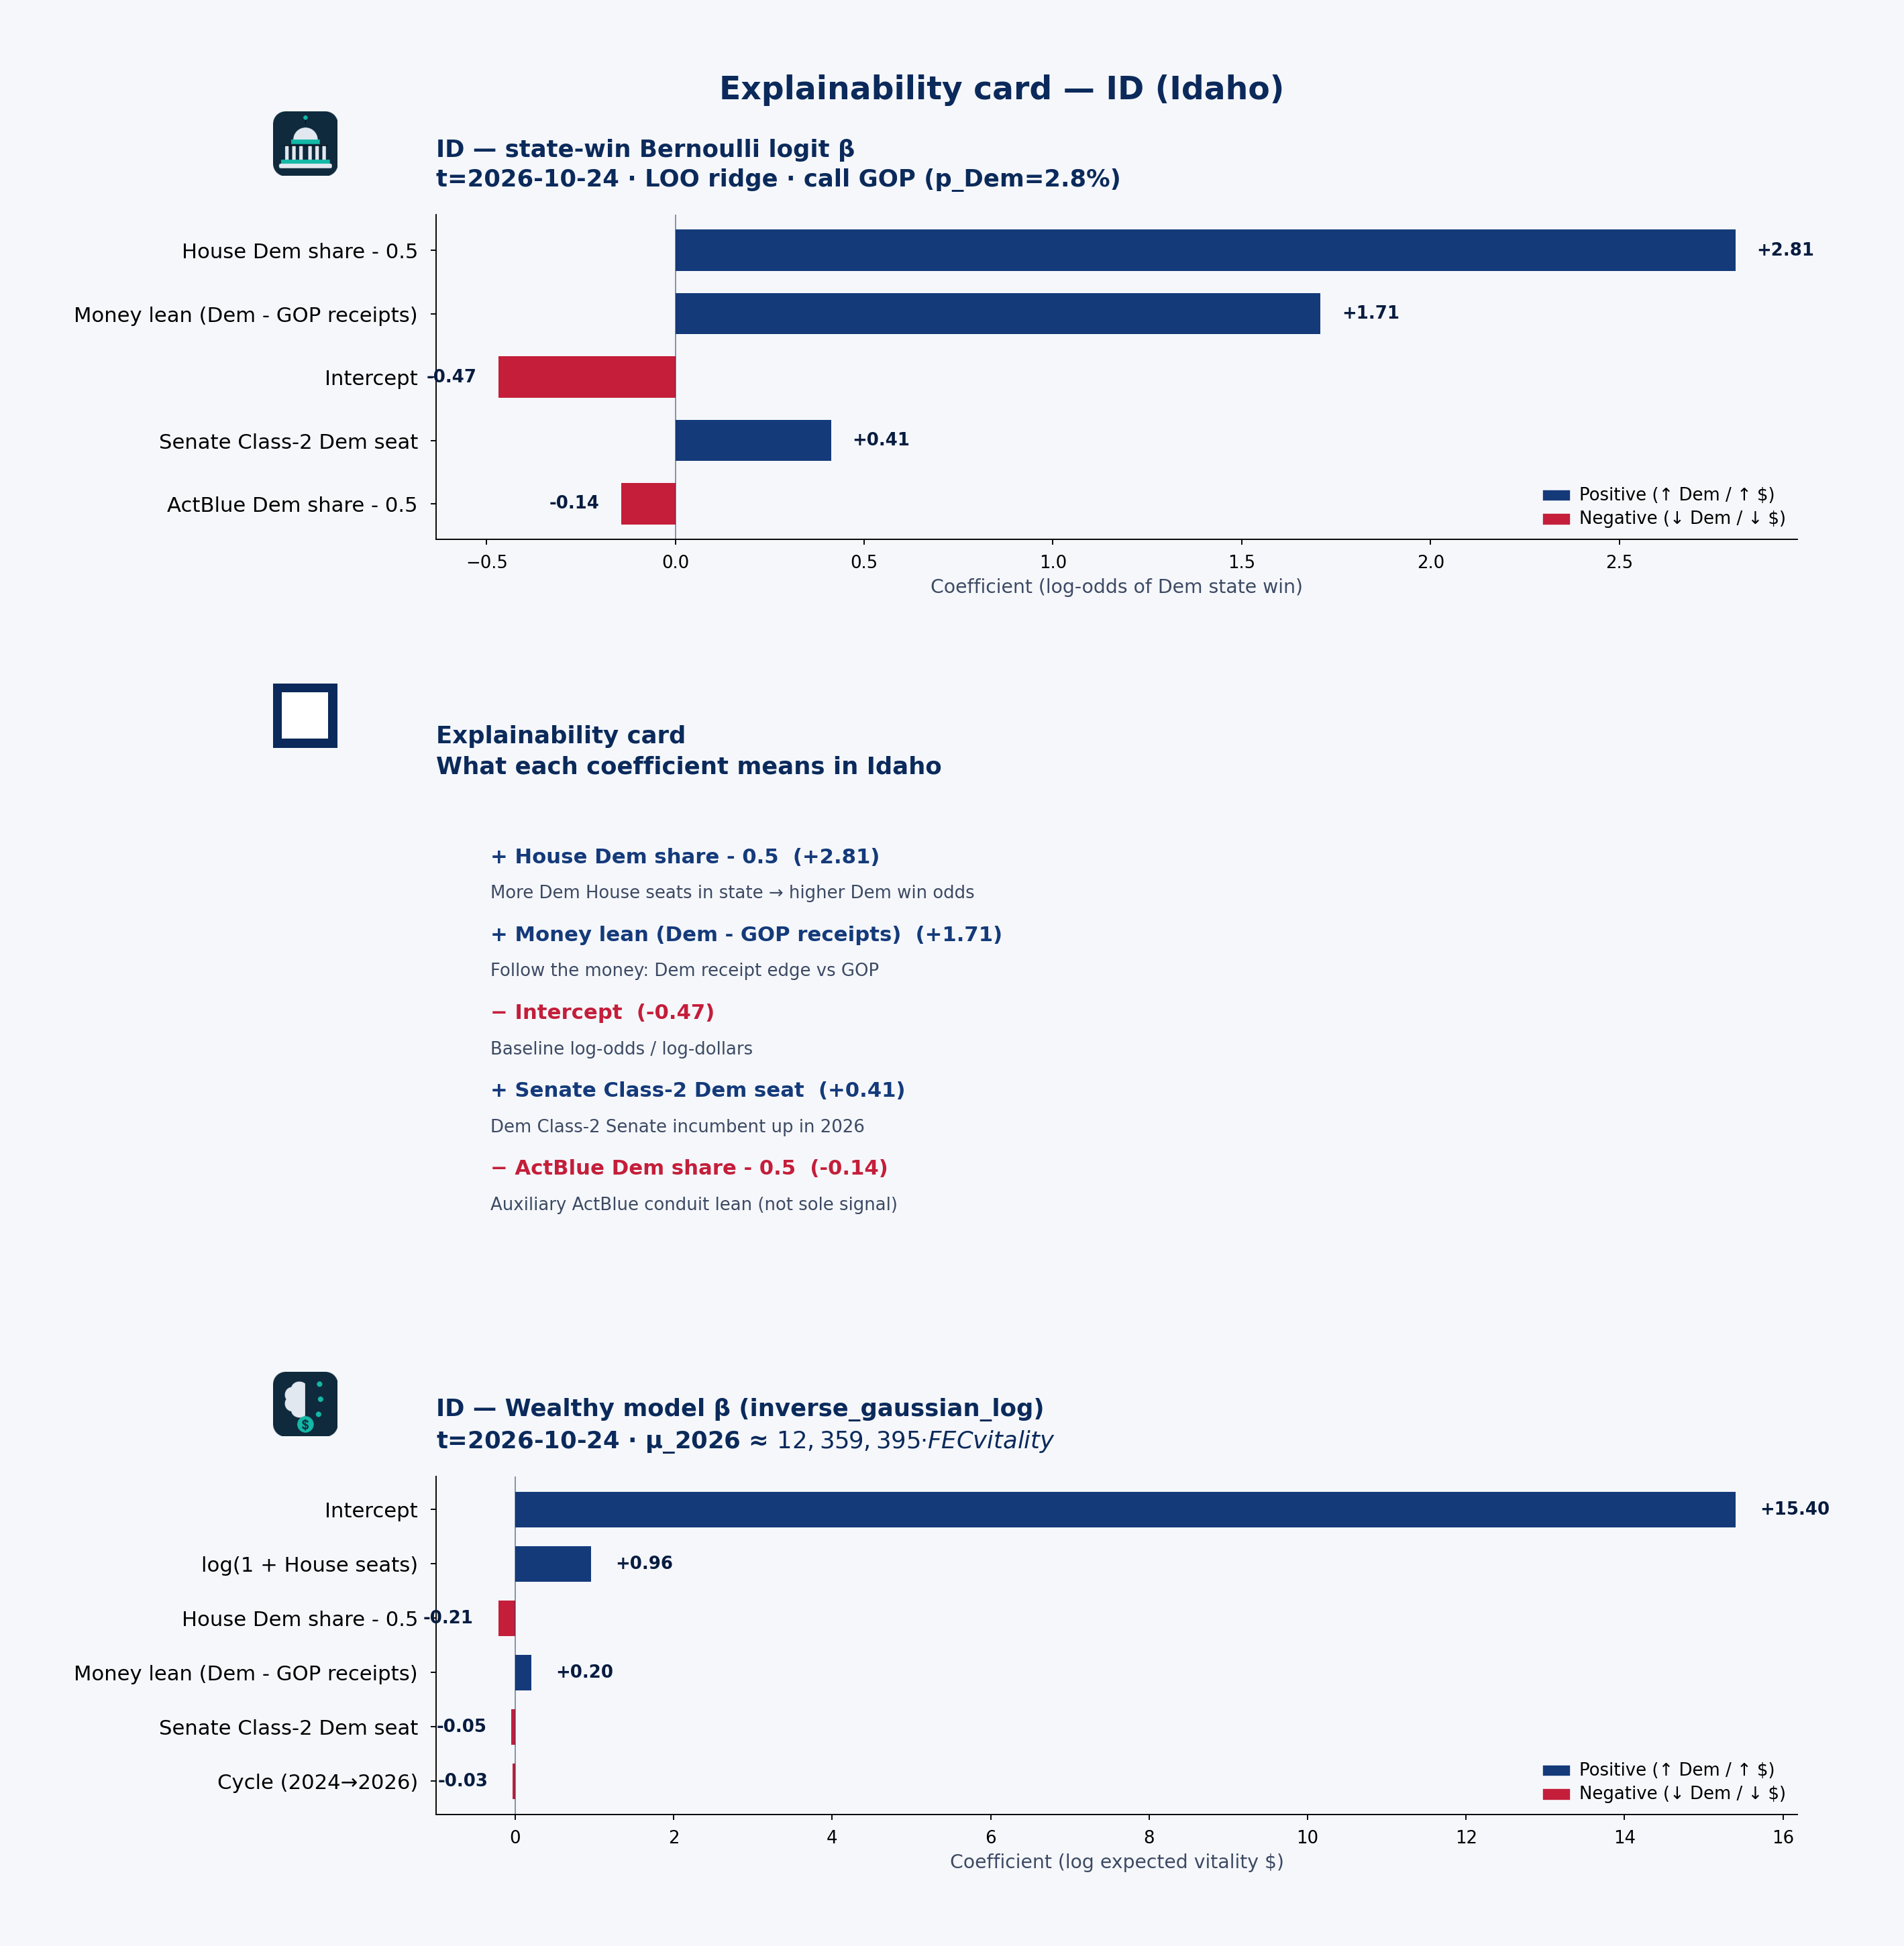 State explainability card · state-win LOO coefficient stability, plain language, and Wealthy model · ID · t=2026-10-24
Statewide call: GOP (p_Dem=3%) · 2026 money shape: balanced
Receipts by cycle (campaign-finance weball)
| Cycle | Candidate | Total receipts | Individual | PAC (other pol. cmte) |
|---|---|---|---|---|
| 2024 | CRAPO, MICHAEL D | $1.13M | $333k | $525k |
| 2026 | CRAPO, MICHAEL D | $1.31M | $287k | $417k |
| 2024 | FULCHER, RUSSELL | $638k | $276k | $351k |
| 2026 | FULCHER, RUSSELL | $848k | $435k | $397k |
| 2024 | RISCH, JAMES E MR. | $632k | $310k | $220k |
| 2026 | RISCH, JAMES E MR. | $3.94M | $2.40M | $1.16M |
| 2024 | SIMPSON, MICHAEL | $1.56M | $626k | $895k |
| 2026 | SIMPSON, MICHAEL | $1.41M | $622k | $786k |
PAC & individual money
PAC money was about $1.99M of $3.96M total receipts in 2024 and $2.76M of $7.50M in 2026. Direct committee→candidate 24K (non-memo) ran about $2.14M (2024) / $2.86M (2026). Itemized individual share from Idaho: 39.1% (2024) / 50.0% (2026).
RISCH, JAMES E MR.: Cycle-to-date weball receipts ~$3.94M, with PAC direct 24K $211k → $1.24M vs 2024. the public campaign-finance data feed by-size individual totals are not loaded in this 50-state snapshot.
Spotlight candidates
RISCH, JAMES E MR.
- In 2024, $310k of $632k came from individuals; PAC (other pol. cmte) $220k.
- In 2026, $2.40M of $3.94M came from individuals; PAC (other pol. cmte) $1.16M.
SIMPSON, MICHAEL
- In 2024, $626k of $1.56M came from individuals; PAC (other pol. cmte) $895k.
- In 2026, $622k of $1.41M came from individuals; PAC (other pol. cmte) $786k.
CRAPO, MICHAEL D
- In 2024, $333k of $1.13M came from individuals; PAC (other pol. cmte) $525k.
- In 2026, $287k of $1.31M came from individuals; PAC (other pol. cmte) $417k.
Short talking points — money & predicted voting
Open with the model set’s statewide call: GOP favored at about 3% Dem win probability on public campaign-finance + roster features — not a poll. Then the money shape: Idaho federal candidates look balanced in 2026 weball (about $2.76M PAC / $3.75M individual of $7.50M total). Spotlight RISCH, JAMES E MR. for one concrete receipt picture. Close civic: these are public contribution patterns and a transparent forecast model call — not evidence of wrongdoing, and not a substitute for Cook or election-night counts.
IL — Illinois
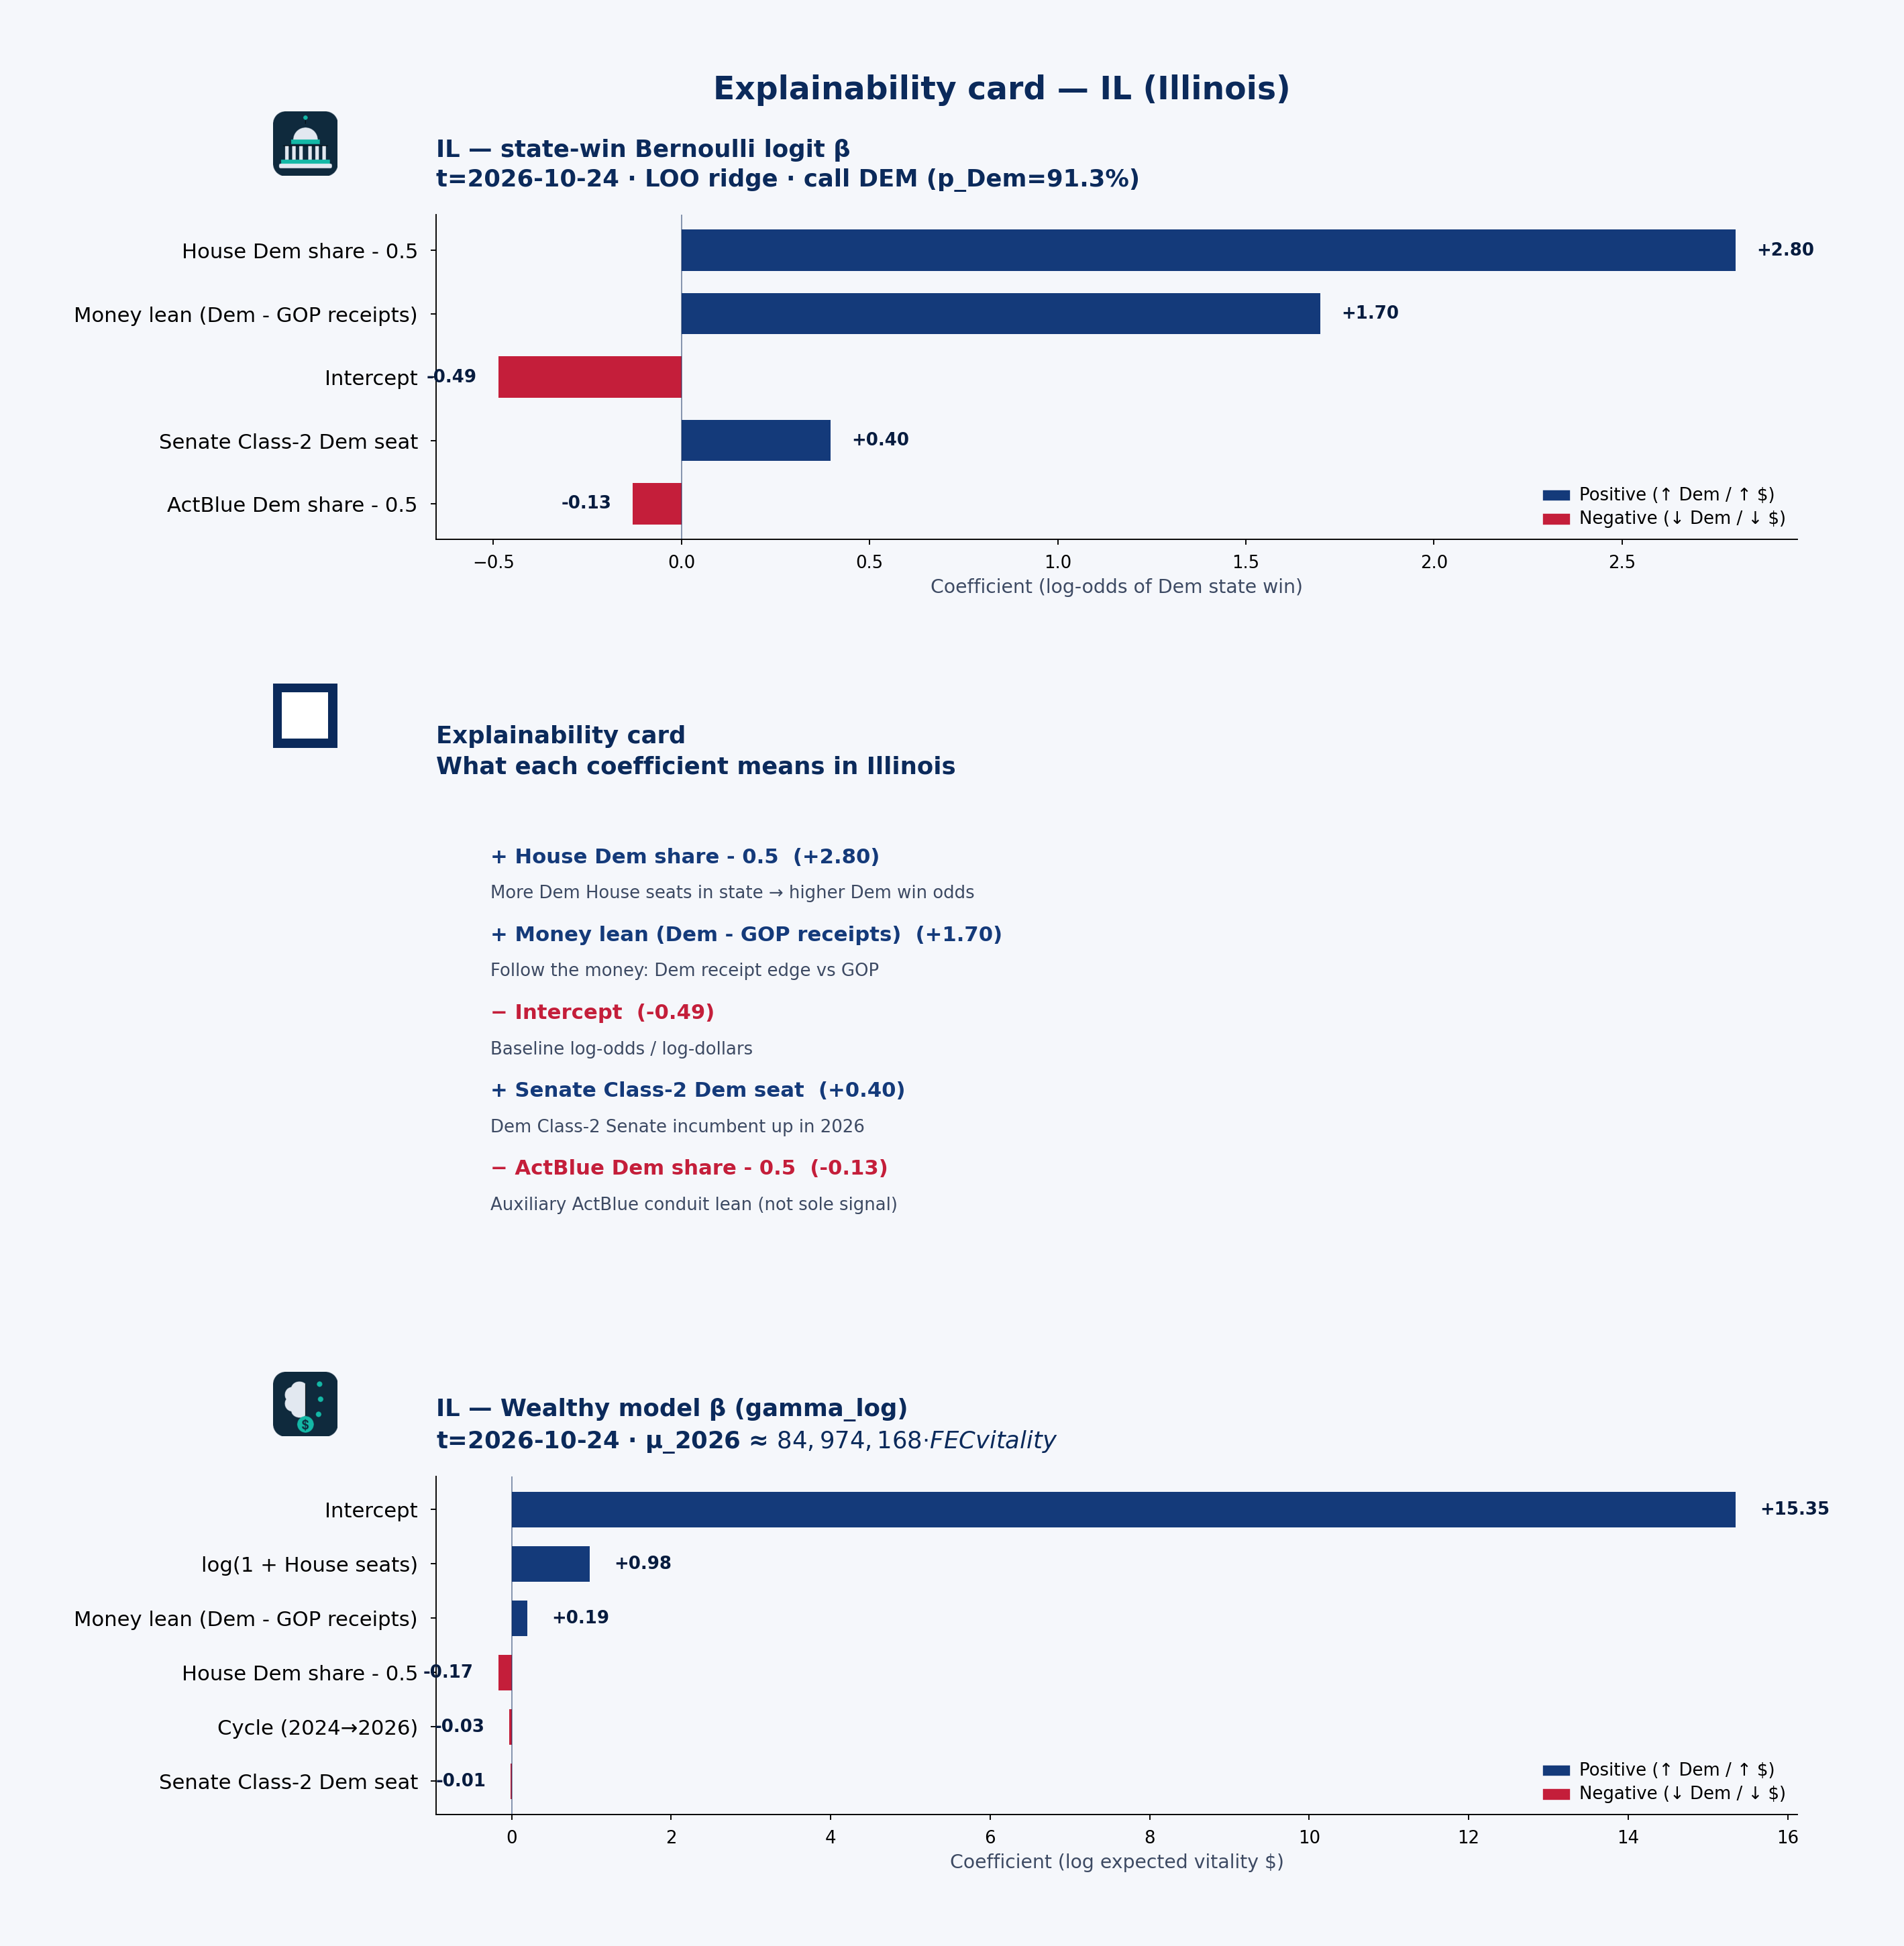 State explainability card · state-win LOO coefficient stability, plain language, and Wealthy model · IL · t=2026-10-24
Statewide call: DEM (p_Dem=91%) · 2026 money shape: balanced
Receipts by cycle (campaign-finance weball)
| Cycle | Candidate | Total receipts | Individual | PAC (other pol. cmte) |
|---|---|---|---|---|
| 2024 | BUDZINSKI, NIKKI | $4.34M | $2.58M | $1.61M |
| 2026 | BUDZINSKI, NIKKI | $3.65M | $2.04M | $1.52M |
| 2024 | DUCKWORTH, L. TAMMY | $4.57M | $3.68M | $261k |
| 2026 | DUCKWORTH, L. TAMMY | $6.05M | $5.29M | $170k |
| 2026 | KELLY, ROBIN | $3.51M | $1.08M | $229k |
| 2026 | KRISHNAMOORTHI, S | $31.56M | $11.01M | $495k |
| 2024 | LAHOOD, DARIN MCKAY | $3.75M | $985k | $2.14M |
| 2026 | LAHOOD, DARIN MCKAY | $4.21M | $932k | $2.03M |
| 2024 | SCHNEIDER, BRADLEY S. | $3.86M | $2.24M | $1.60M |
| 2026 | SCHNEIDER, BRADLEY S. | $3.66M | $1.93M | $1.60M |
| 2024 | SORENSEN, ERIC | $5.05M | $3.42M | $1.31M |
| 2026 | SORENSEN, ERIC | $2.66M | $1.50M | $1.02M |
| 2024 | UNDERWOOD, LAUREN | $4.16M | $3.32M | $509k |
| 2026 | UNDERWOOD, LAUREN | $2.85M | $2.10M | $451k |
PAC & individual money
PAC money was about $14.37M of $44.23M total receipts in 2024 and $12.12M of $70.87M in 2026. Direct committee→candidate 24K (non-memo) ran about $14.48M (2024) / $11.02M (2026). Itemized individual share from Illinois: 60.2% (2024) / 47.2% (2026).
KRISHNAMOORTHI, S: Cycle-to-date weball receipts ~$31.56M, with PAC direct 24K $0 → $443k vs 2024. the public campaign-finance data feed by-size individual totals are not loaded in this 50-state snapshot.
Spotlight candidates
KRISHNAMOORTHI, S
- In 2026, $11.01M of $31.56M came from individuals; PAC (other pol. cmte) $495k.
DUCKWORTH, L. TAMMY
- In 2024, $3.68M of $4.57M came from individuals; PAC (other pol. cmte) $261k.
- In 2026, $5.29M of $6.05M came from individuals; PAC (other pol. cmte) $170k.
SORENSEN, ERIC
- In 2024, $3.42M of $5.05M came from individuals; PAC (other pol. cmte) $1.31M.
- In 2026, $1.50M of $2.66M came from individuals; PAC (other pol. cmte) $1.02M.
Short talking points — money & predicted voting
Open with the model set’s statewide call: DEM favored at about 91% Dem win probability on public campaign-finance + roster features — not a poll. Then the money shape: Illinois federal candidates look balanced in 2026 weball (about $12.12M PAC / $33.43M individual of $70.87M total). Spotlight KRISHNAMOORTHI, S for one concrete receipt picture. Close civic: these are public contribution patterns and a transparent forecast model call — not evidence of wrongdoing, and not a substitute for Cook or election-night counts.
IN — Indiana
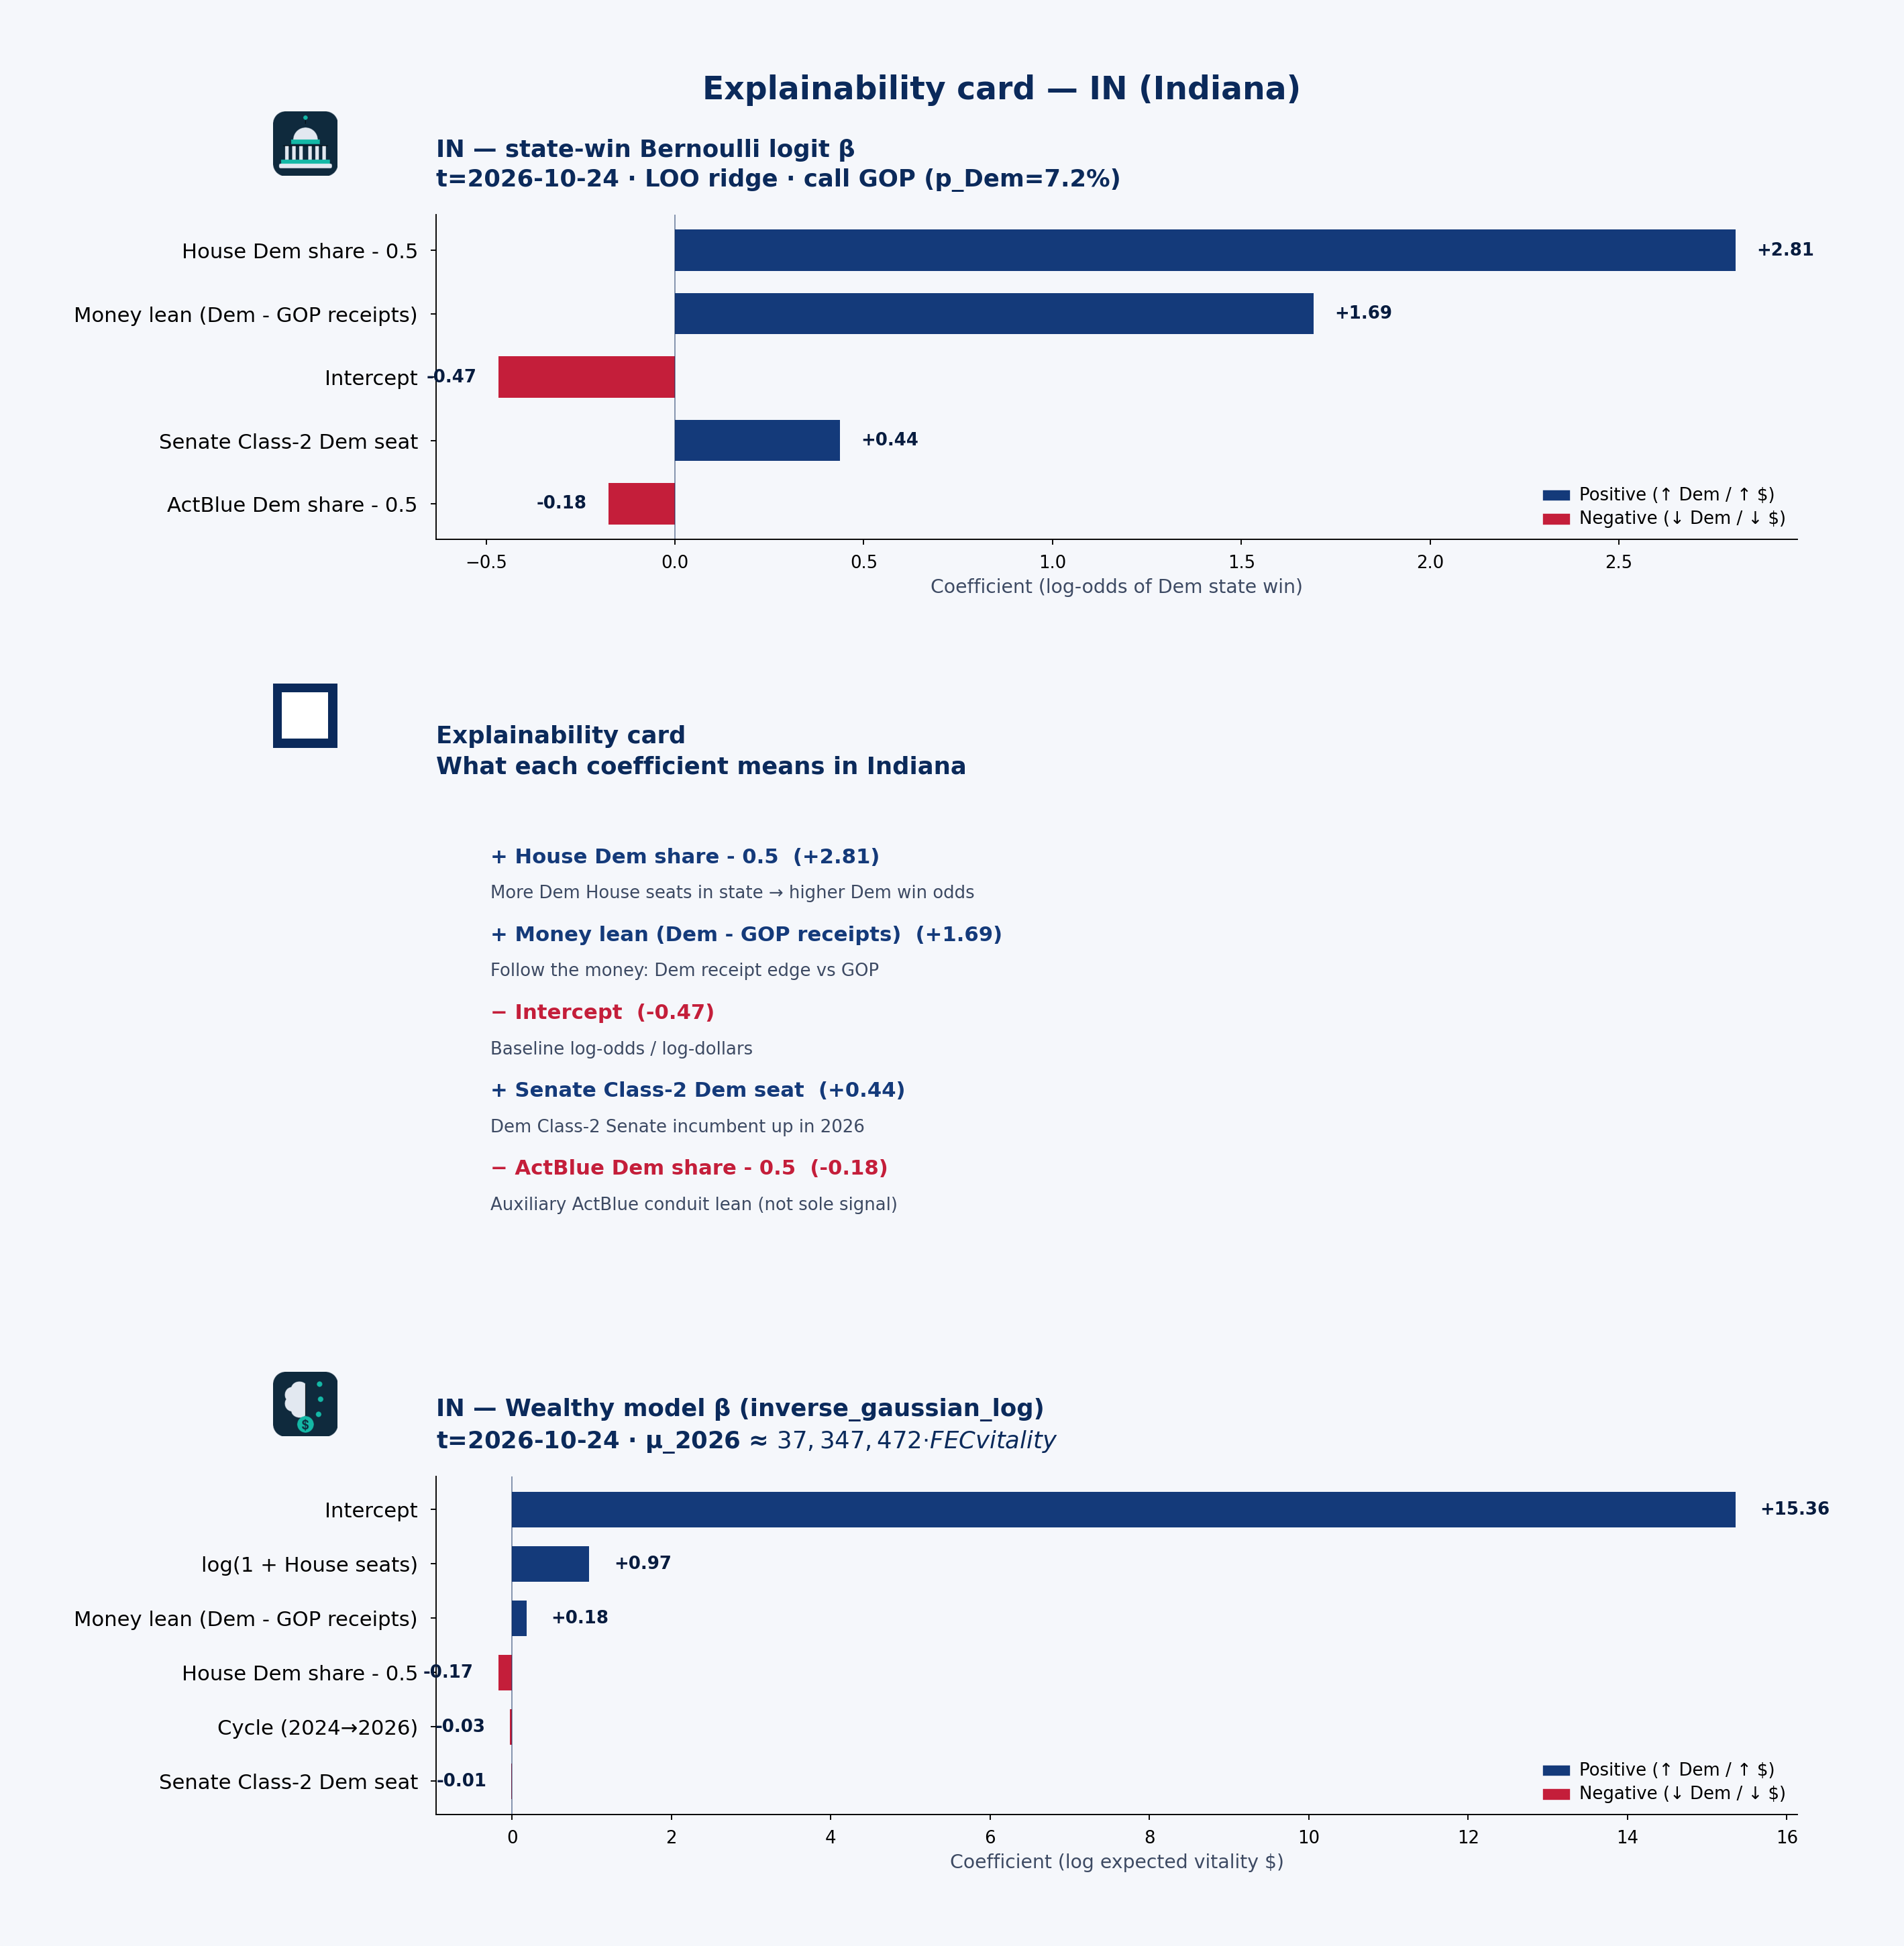 State explainability card · state-win LOO coefficient stability, plain language, and Wealthy model · IN · t=2026-10-24
Statewide call: GOP (p_Dem=7%) · 2026 money shape: balanced
Receipts by cycle (campaign-finance weball)
| Cycle | Candidate | Total receipts | Individual | PAC (other pol. cmte) |
|---|---|---|---|---|
| 2024 | BANKS, JAMES E. HON. | $7.34M | $4.53M | $1.43M |
| 2026 | BANKS, JAMES E. HON. | $2.68M | $1.14M | $594k |
| 2024 | HOUCHIN, ERIN | $1.72M | $363k | $1000k |
| 2026 | HOUCHIN, ERIN | $2.21M | $404k | $1.27M |
| 2024 | MESSMER, MARK MR. | $1.55M | $1.01M | $361k |
| 2026 | MESSMER, MARK MR. | $1.42M | $309k | $548k |
| 2024 | MRVAN, FRANK J. | $3.20M | $1.94M | $1.18M |
| 2026 | MRVAN, FRANK J. | $3.04M | $1.63M | $1.26M |
| 2024 | SHREVE, JEFFERSON | $6.24M | $129k | $171k |
| 2026 | SHREVE, JEFFERSON | $2.53M | $146k | $378k |
| 2024 | SPARTZ, VICTORIA | $1.98M | $999k | $196k |
| 2026 | SPARTZ, VICTORIA | $2.19M | $1.38M | $209k |
| 2024 | YAKYM, RUDY C. III | $3.73M | $2.24M | $731k |
| 2026 | YAKYM, RUDY C. III | $6.58M | $3.76M | $1.56M |
| 2024 | YOUNG, TODD CHRISTOPHER | $1.75M | $662k | $330k |
| 2026 | YOUNG, TODD CHRISTOPHER | $5.08M | $1.37M | $749k |
PAC & individual money
PAC money was about $6.16M of $28.96M total receipts in 2024 and $7.92M of $28.43M in 2026. Direct committee→candidate 24K (non-memo) ran about $6.00M (2024) / $6.76M (2026). Itemized individual share from Indiana: 42.6% (2024) / 39.2% (2026).
BANKS, JAMES E. HON.: Cycle-to-date weball receipts ~$2.68M, with PAC direct 24K $1.30M → $525k vs 2024. the public campaign-finance data feed by-size individual totals are not loaded in this 50-state snapshot.
Spotlight candidates
BANKS, JAMES E. HON.
- In 2024, $4.53M of $7.34M came from individuals; PAC (other pol. cmte) $1.43M.
- In 2026, $1.14M of $2.68M came from individuals; PAC (other pol. cmte) $594k.
YAKYM, RUDY C. III
- In 2024, $2.24M of $3.73M came from individuals; PAC (other pol. cmte) $731k.
- In 2026, $3.76M of $6.58M came from individuals; PAC (other pol. cmte) $1.56M.
SHREVE, JEFFERSON
- In 2024, $129k of $6.24M came from individuals; PAC (other pol. cmte) $171k.
- In 2026, $146k of $2.53M came from individuals; PAC (other pol. cmte) $378k.
Short talking points — money & predicted voting
Open with the model set’s statewide call: GOP favored at about 7% Dem win probability on public campaign-finance + roster features — not a poll. Then the money shape: Indiana federal candidates look balanced in 2026 weball (about $7.92M PAC / $11.14M individual of $28.43M total). Spotlight BANKS, JAMES E. HON. for one concrete receipt picture. Close civic: these are public contribution patterns and a transparent forecast model call — not evidence of wrongdoing, and not a substitute for Cook or election-night counts.
KS — Kansas
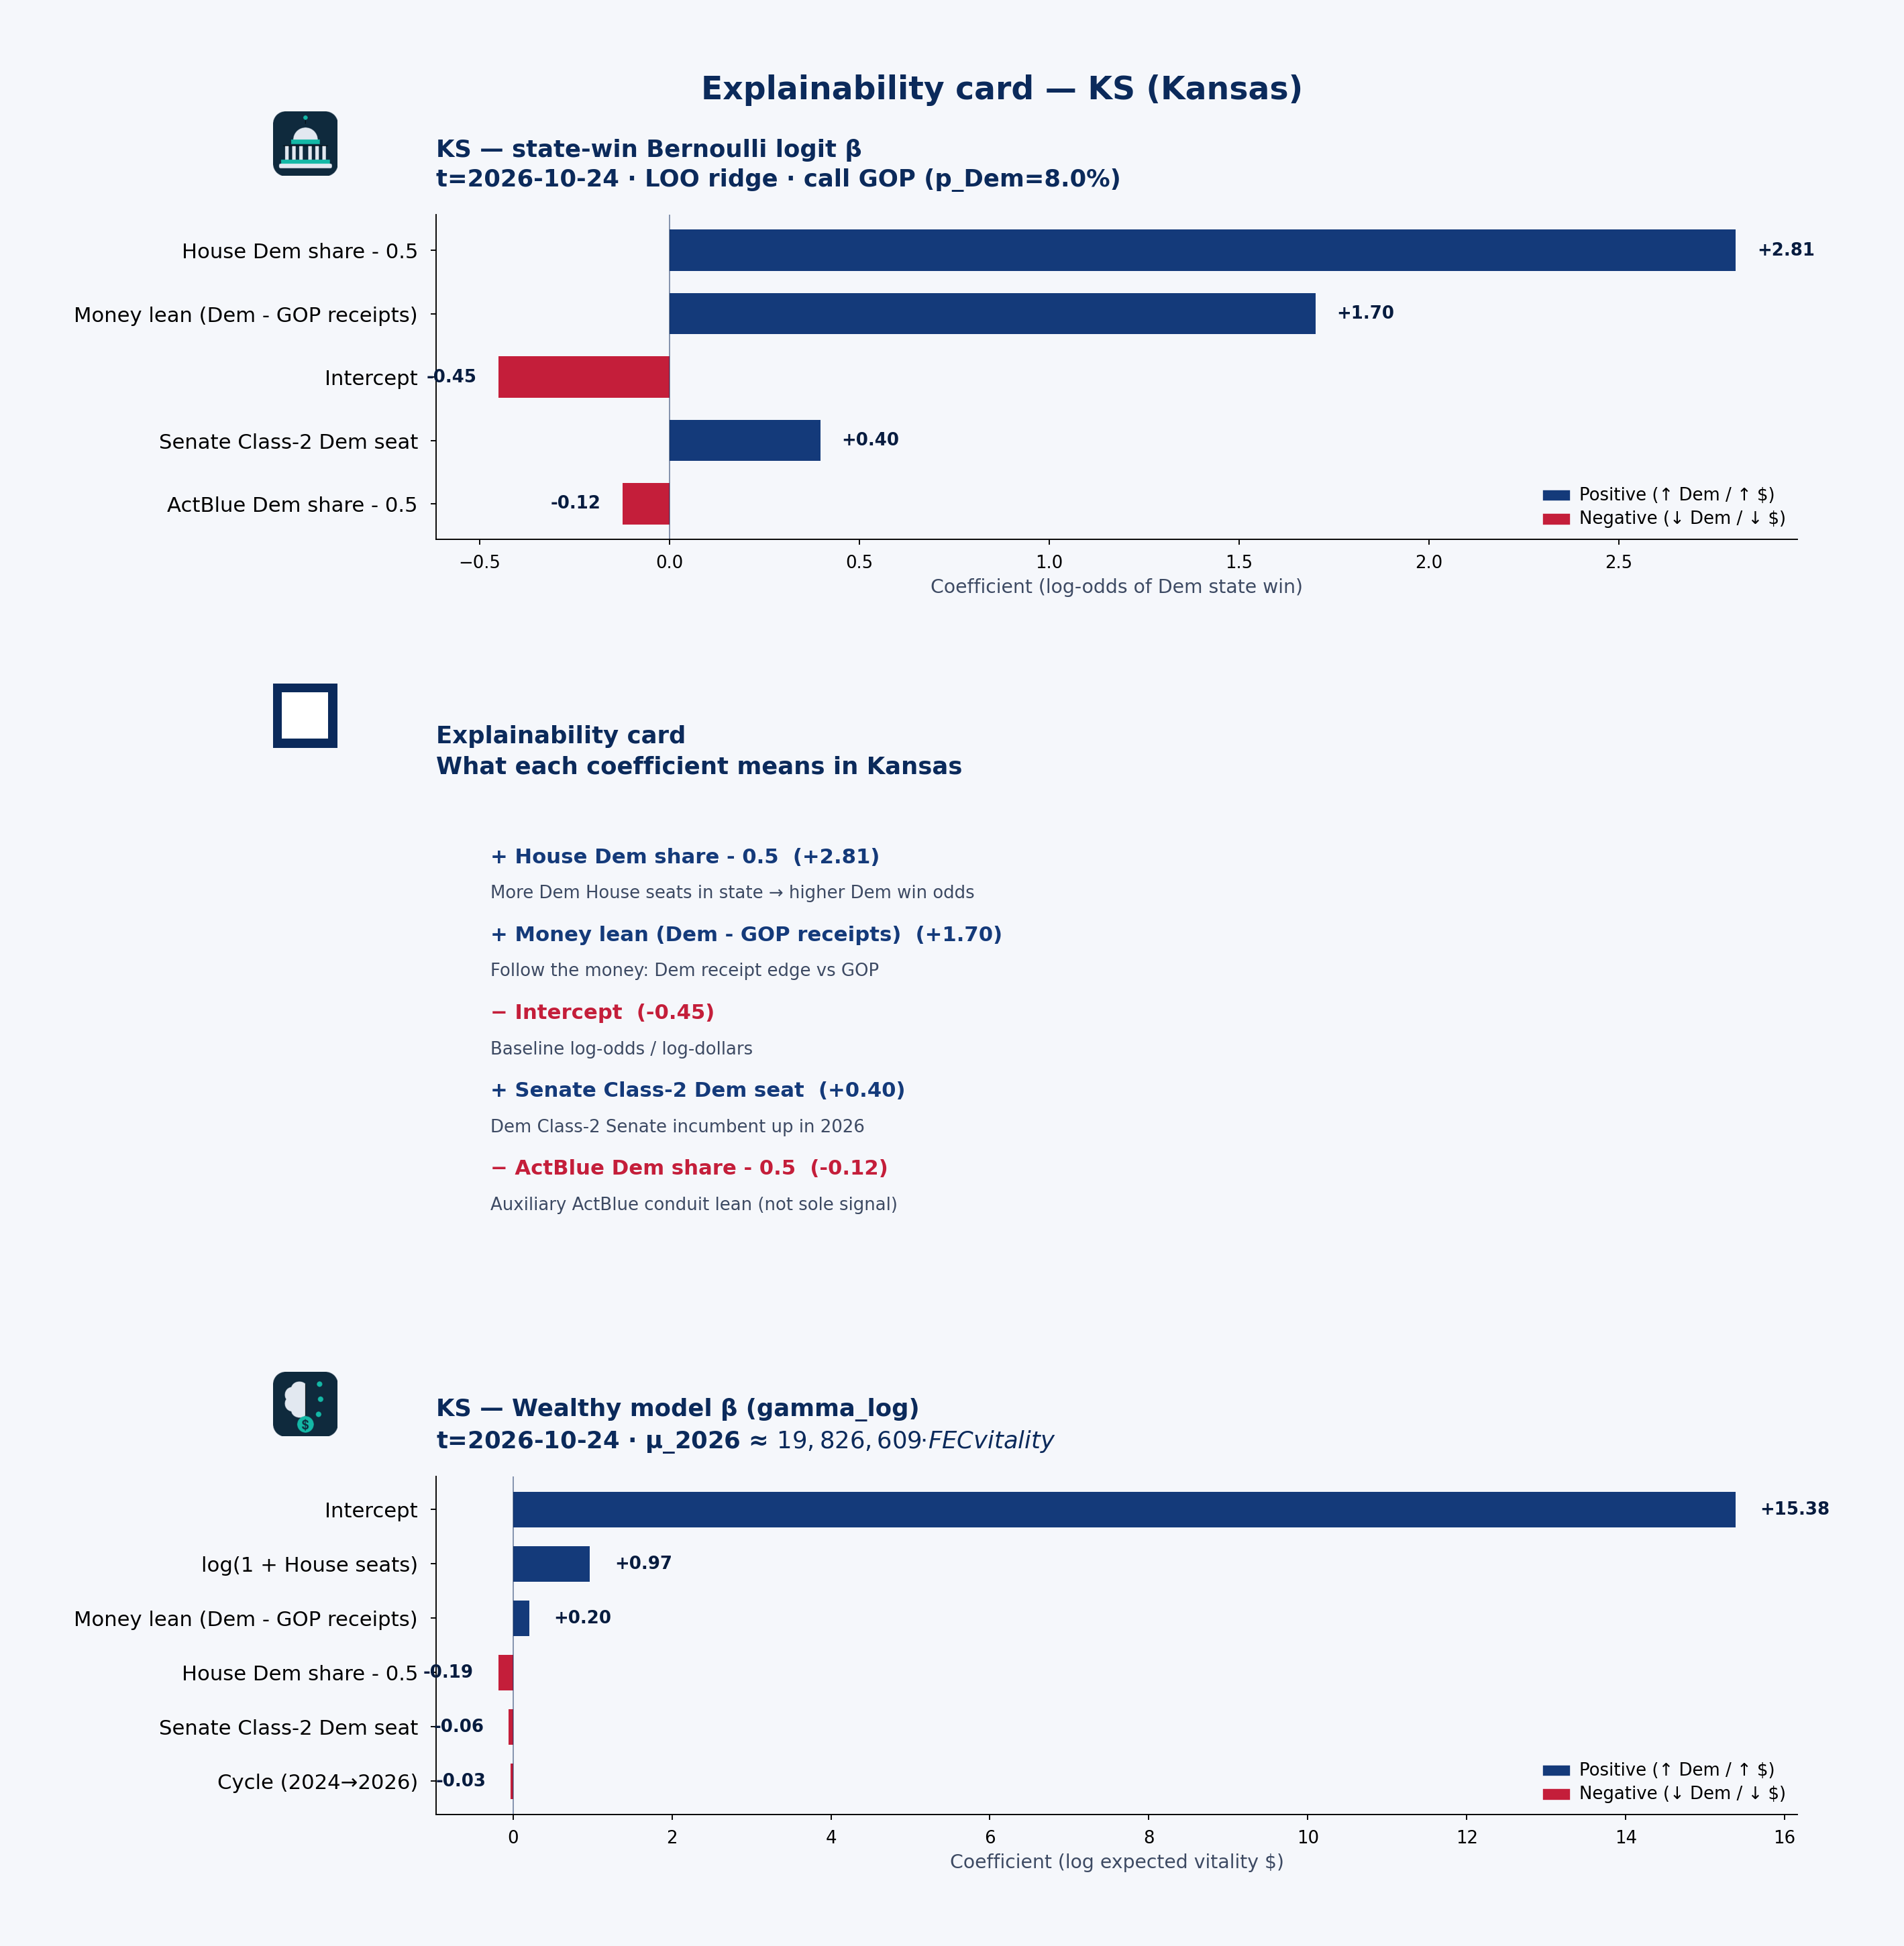 State explainability card · state-win LOO coefficient stability, plain language, and Wealthy model · KS · t=2026-10-24
Statewide call: GOP (p_Dem=8%) · 2026 money shape: balanced
Receipts by cycle (campaign-finance weball)
| Cycle | Candidate | Total receipts | Individual | PAC (other pol. cmte) |
|---|---|---|---|---|
| 2024 | DAVIDS, SHARICE | $5.98M | $4.29M | $1.52M |
| 2026 | DAVIDS, SHARICE | $4.66M | $3.53M | $1.09M |
| 2024 | ESTES, RON | $2.29M | $406k | $1.33M |
| 2026 | ESTES, RON | $2.20M | $387k | $1.33M |
| 2024 | MANN, TRACEY ROBERT | $1.52M | $432k | $776k |
| 2026 | MANN, TRACEY ROBERT | $1.79M | $397k | $816k |
| 2024 | MARSHALL, ROGER W | $1.47M | $369k | $837k |
| 2026 | MARSHALL, ROGER W | $5.35M | $2.51M | $1.90M |
| 2024 | MORAN, JERRY | $1.81M | $200k | $500k |
| 2026 | MORAN, JERRY | $1.56M | $214k | $404k |
| 2024 | SCHMIDT, DEREK | $1.27M | $817k | $416k |
| 2026 | SCHMIDT, DEREK | $1.77M | $1.06M | $643k |
PAC & individual money
PAC money was about $5.38M of $14.34M total receipts in 2024 and $6.18M of $17.34M in 2026. Direct committee→candidate 24K (non-memo) ran about $5.35M (2024) / $5.53M (2026). Itemized individual share from Kansas: 45.4% (2024) / 46.8% (2026).
DAVIDS, SHARICE: Cycle-to-date weball receipts ~$4.66M, with PAC direct 24K $1.53M → $929k vs 2024. the public campaign-finance data feed by-size individual totals are not loaded in this 50-state snapshot.
Spotlight candidates
DAVIDS, SHARICE
- In 2024, $4.29M of $5.98M came from individuals; PAC (other pol. cmte) $1.52M.
- In 2026, $3.53M of $4.66M came from individuals; PAC (other pol. cmte) $1.09M.
MARSHALL, ROGER W
- In 2024, $369k of $1.47M came from individuals; PAC (other pol. cmte) $837k.
- In 2026, $2.51M of $5.35M came from individuals; PAC (other pol. cmte) $1.90M.
ESTES, RON
- In 2024, $406k of $2.29M came from individuals; PAC (other pol. cmte) $1.33M.
- In 2026, $387k of $2.20M came from individuals; PAC (other pol. cmte) $1.33M.
Short talking points — money & predicted voting
Open with the model set’s statewide call: GOP favored at about 8% Dem win probability on public campaign-finance + roster features — not a poll. Then the money shape: Kansas federal candidates look balanced in 2026 weball (about $6.18M PAC / $8.11M individual of $17.34M total). Spotlight DAVIDS, SHARICE for one concrete receipt picture. Close civic: these are public contribution patterns and a transparent forecast model call — not evidence of wrongdoing, and not a substitute for Cook or election-night counts.
KY — Kentucky
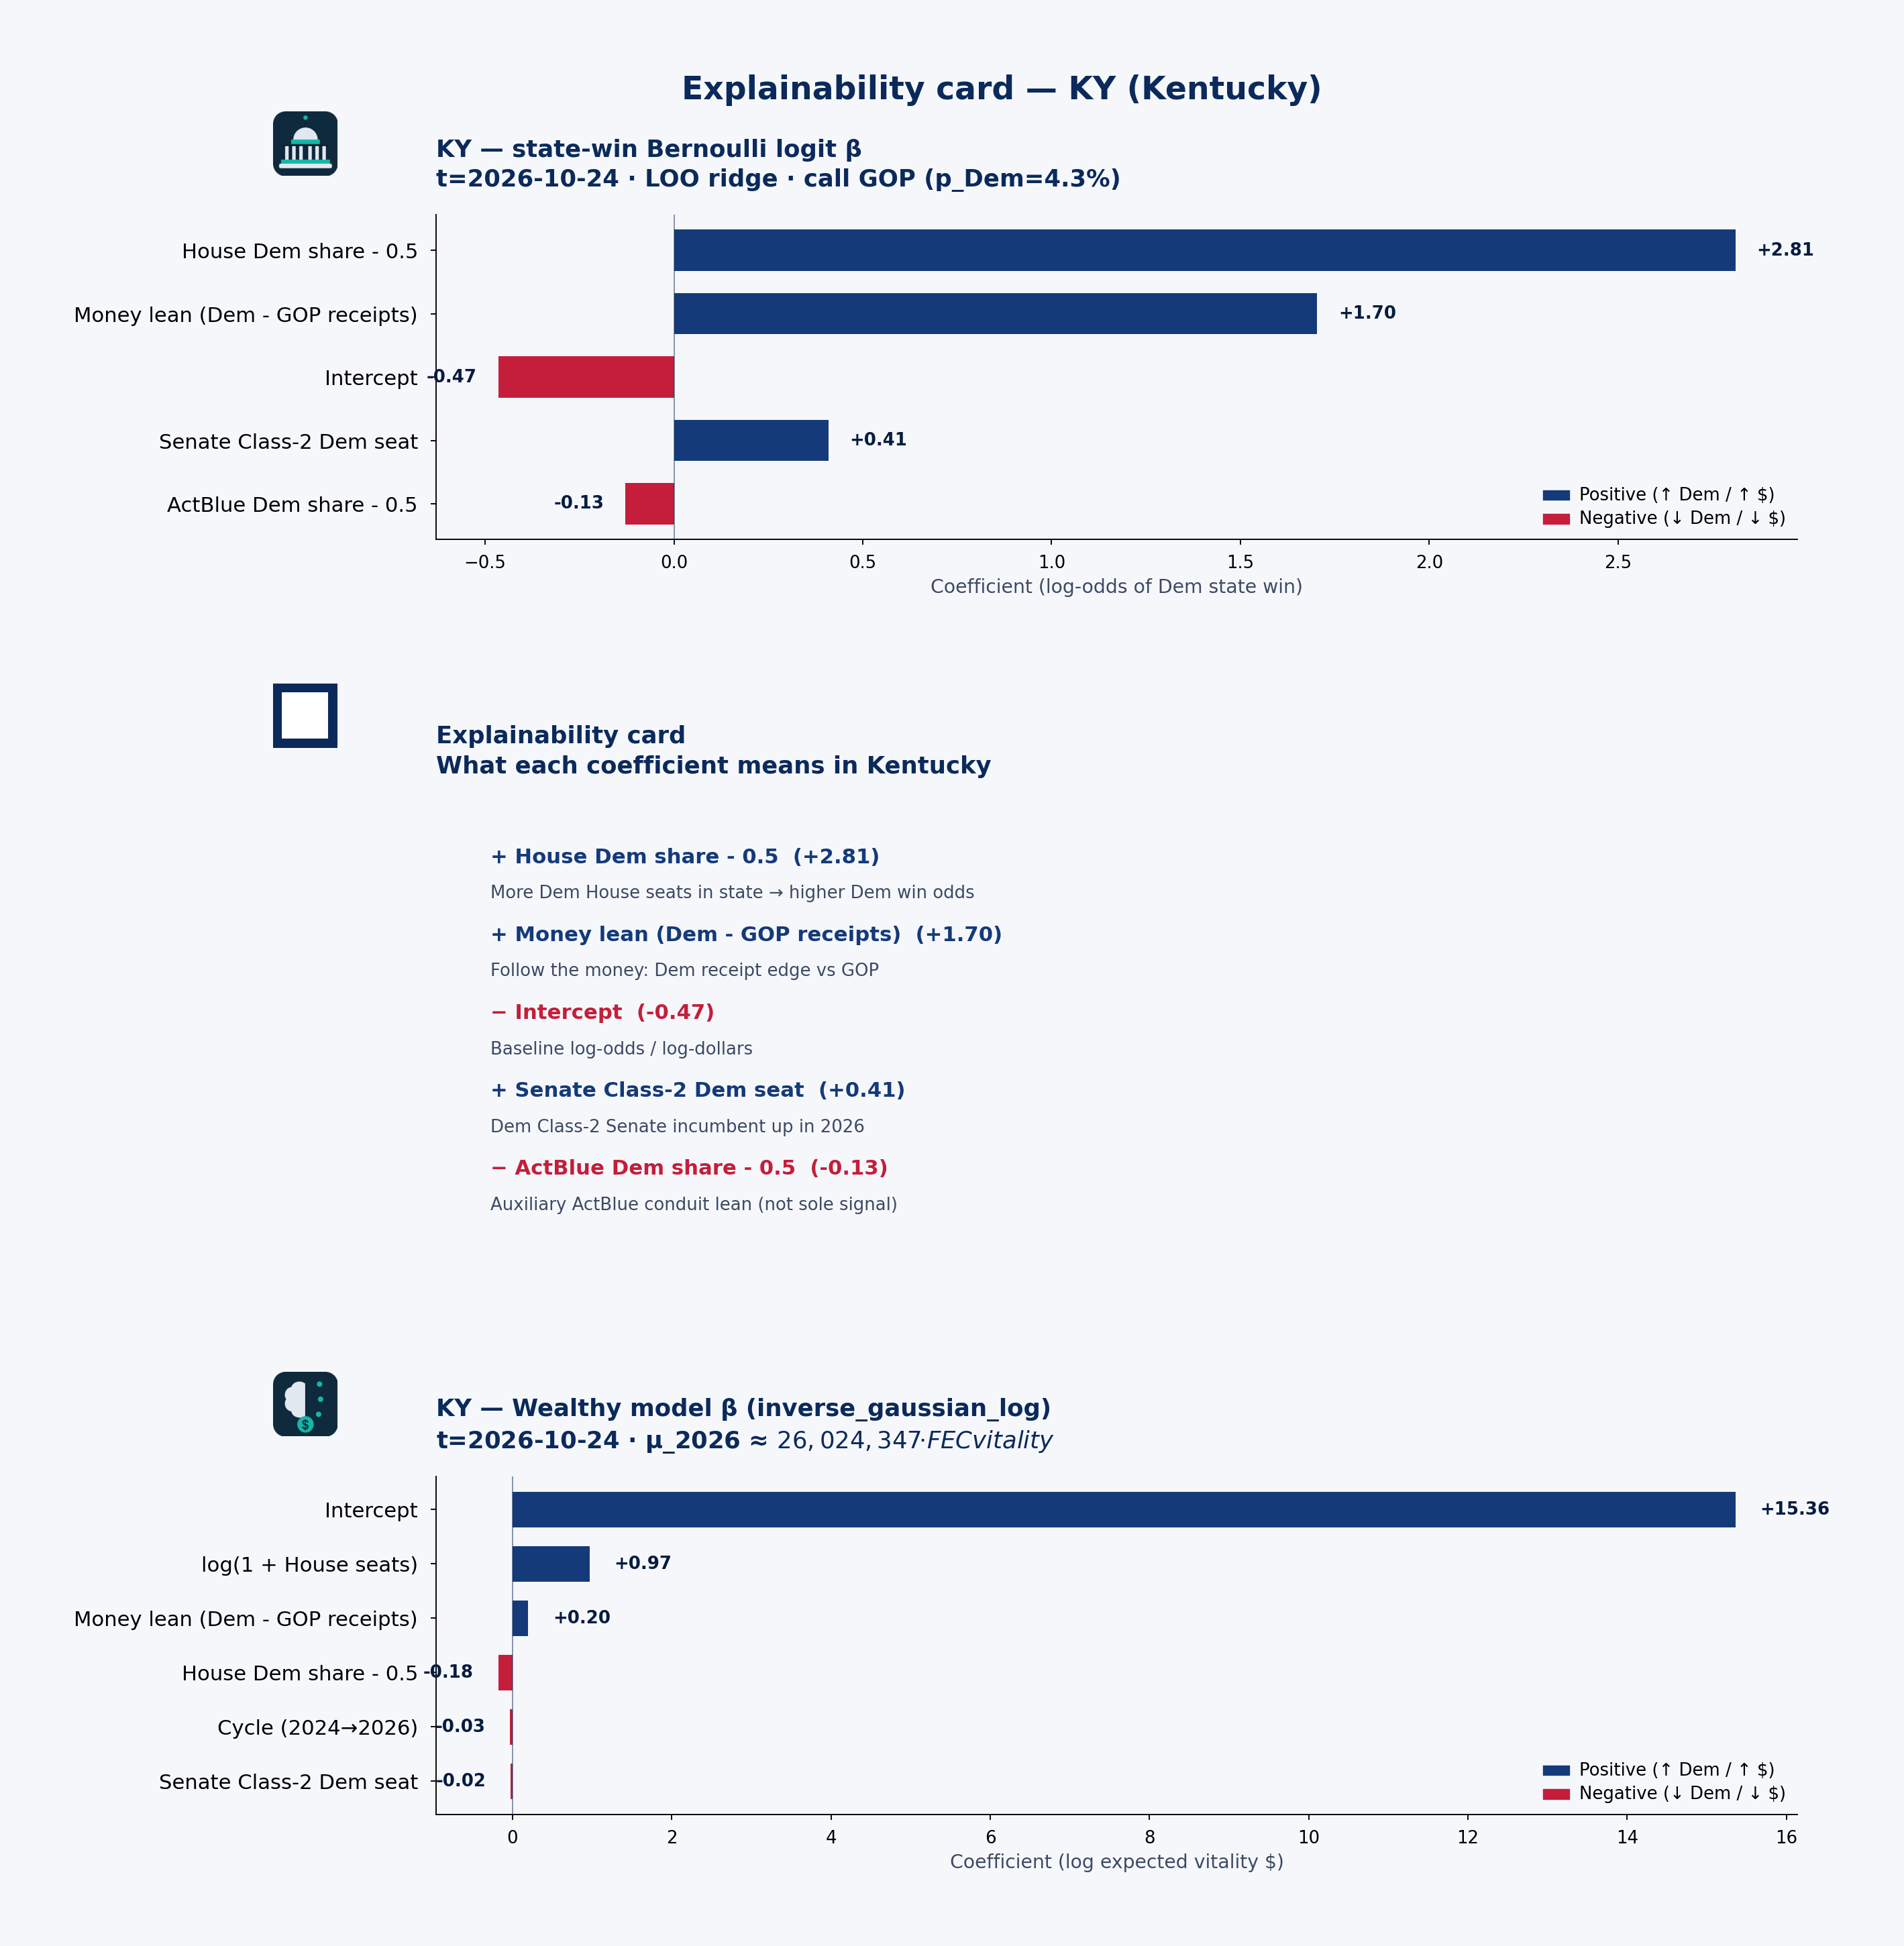 State explainability card · state-win LOO coefficient stability, plain language, and Wealthy model · KY · t=2026-10-24
Statewide call: GOP (p_Dem=4%) · 2026 money shape: balanced
Receipts by cycle (campaign-finance weball)
| Cycle | Candidate | Total receipts | Individual | PAC (other pol. cmte) |
|---|---|---|---|---|
| 2026 | BARR, GARLAND ANDY | $12.54M | $6.93M | $2.49M |
| 2024 | COMER, JAMES | $7.65M | $6.67M | $806k |
| 2026 | COMER, JAMES | $2.32M | $1.73M | $569k |
| 2026 | GUTHRIE, S. BRETT BRETT HON. | $5.99M | $1.80M | $3.38M |
| 2024 | GUTHRIE, S. BRETT HON. | $3.85M | $994k | $2.84M |
| 2024 | MASSIE, THOMAS H. | $1.35M | $1.11M | $215k |
| 2026 | MASSIE, THOMAS H. | $8.89M | $8.70M | $117k |
| 2024 | MCCONNELL, MITCH | $1.20M | $720k | $265k |
| 2026 | MCCONNELL, MITCH | $279k | $19k | $15k |
| 2024 | MCGARVEY, MORGAN | $2.18M | $1.24M | $649k |
| 2026 | MCGARVEY, MORGAN | $2.00M | $1.04M | $717k |
| 2024 | PAUL, RAND | $8.49M | $7.72M | $98k |
| 2026 | PAUL, RAND | $4.57M | $3.85M | $101k |
| 2024 | ROGERS, HAROLD DALLAS | $1.06M | $571k | $461k |
| 2026 | ROGERS, HAROLD DALLAS | $1.03M | $495k | $397k |
PAC & individual money
PAC money was about $5.34M of $25.79M total receipts in 2024 and $7.79M of $37.61M in 2026. Direct committee→candidate 24K (non-memo) ran about $5.12M (2024) / $6.22M (2026). Itemized individual share from Kentucky: 73.8% (2024) / 65.3% (2026).
BARR, GARLAND ANDY: Cycle-to-date weball receipts ~$12.54M, with PAC direct 24K $0 → $1.15M vs 2024. the public campaign-finance data feed by-size individual totals are not loaded in this 50-state snapshot.
Spotlight candidates
BARR, GARLAND ANDY
- In 2026, $6.93M of $12.54M came from individuals; PAC (other pol. cmte) $2.49M.
MASSIE, THOMAS H.
- In 2024, $1.11M of $1.35M came from individuals; PAC (other pol. cmte) $215k.
- In 2026, $8.70M of $8.89M came from individuals; PAC (other pol. cmte) $117k.
PAUL, RAND
- In 2024, $7.72M of $8.49M came from individuals; PAC (other pol. cmte) $98k.
- In 2026, $3.85M of $4.57M came from individuals; PAC (other pol. cmte) $101k.
Short talking points — money & predicted voting
Open with the model set’s statewide call: GOP favored at about 4% Dem win probability on public campaign-finance + roster features — not a poll. Then the money shape: Kentucky federal candidates look balanced in 2026 weball (about $7.79M PAC / $24.56M individual of $37.61M total). Spotlight BARR, GARLAND ANDY for one concrete receipt picture. Close civic: these are public contribution patterns and a transparent forecast model call — not evidence of wrongdoing, and not a substitute for Cook or election-night counts.
LA — Louisiana
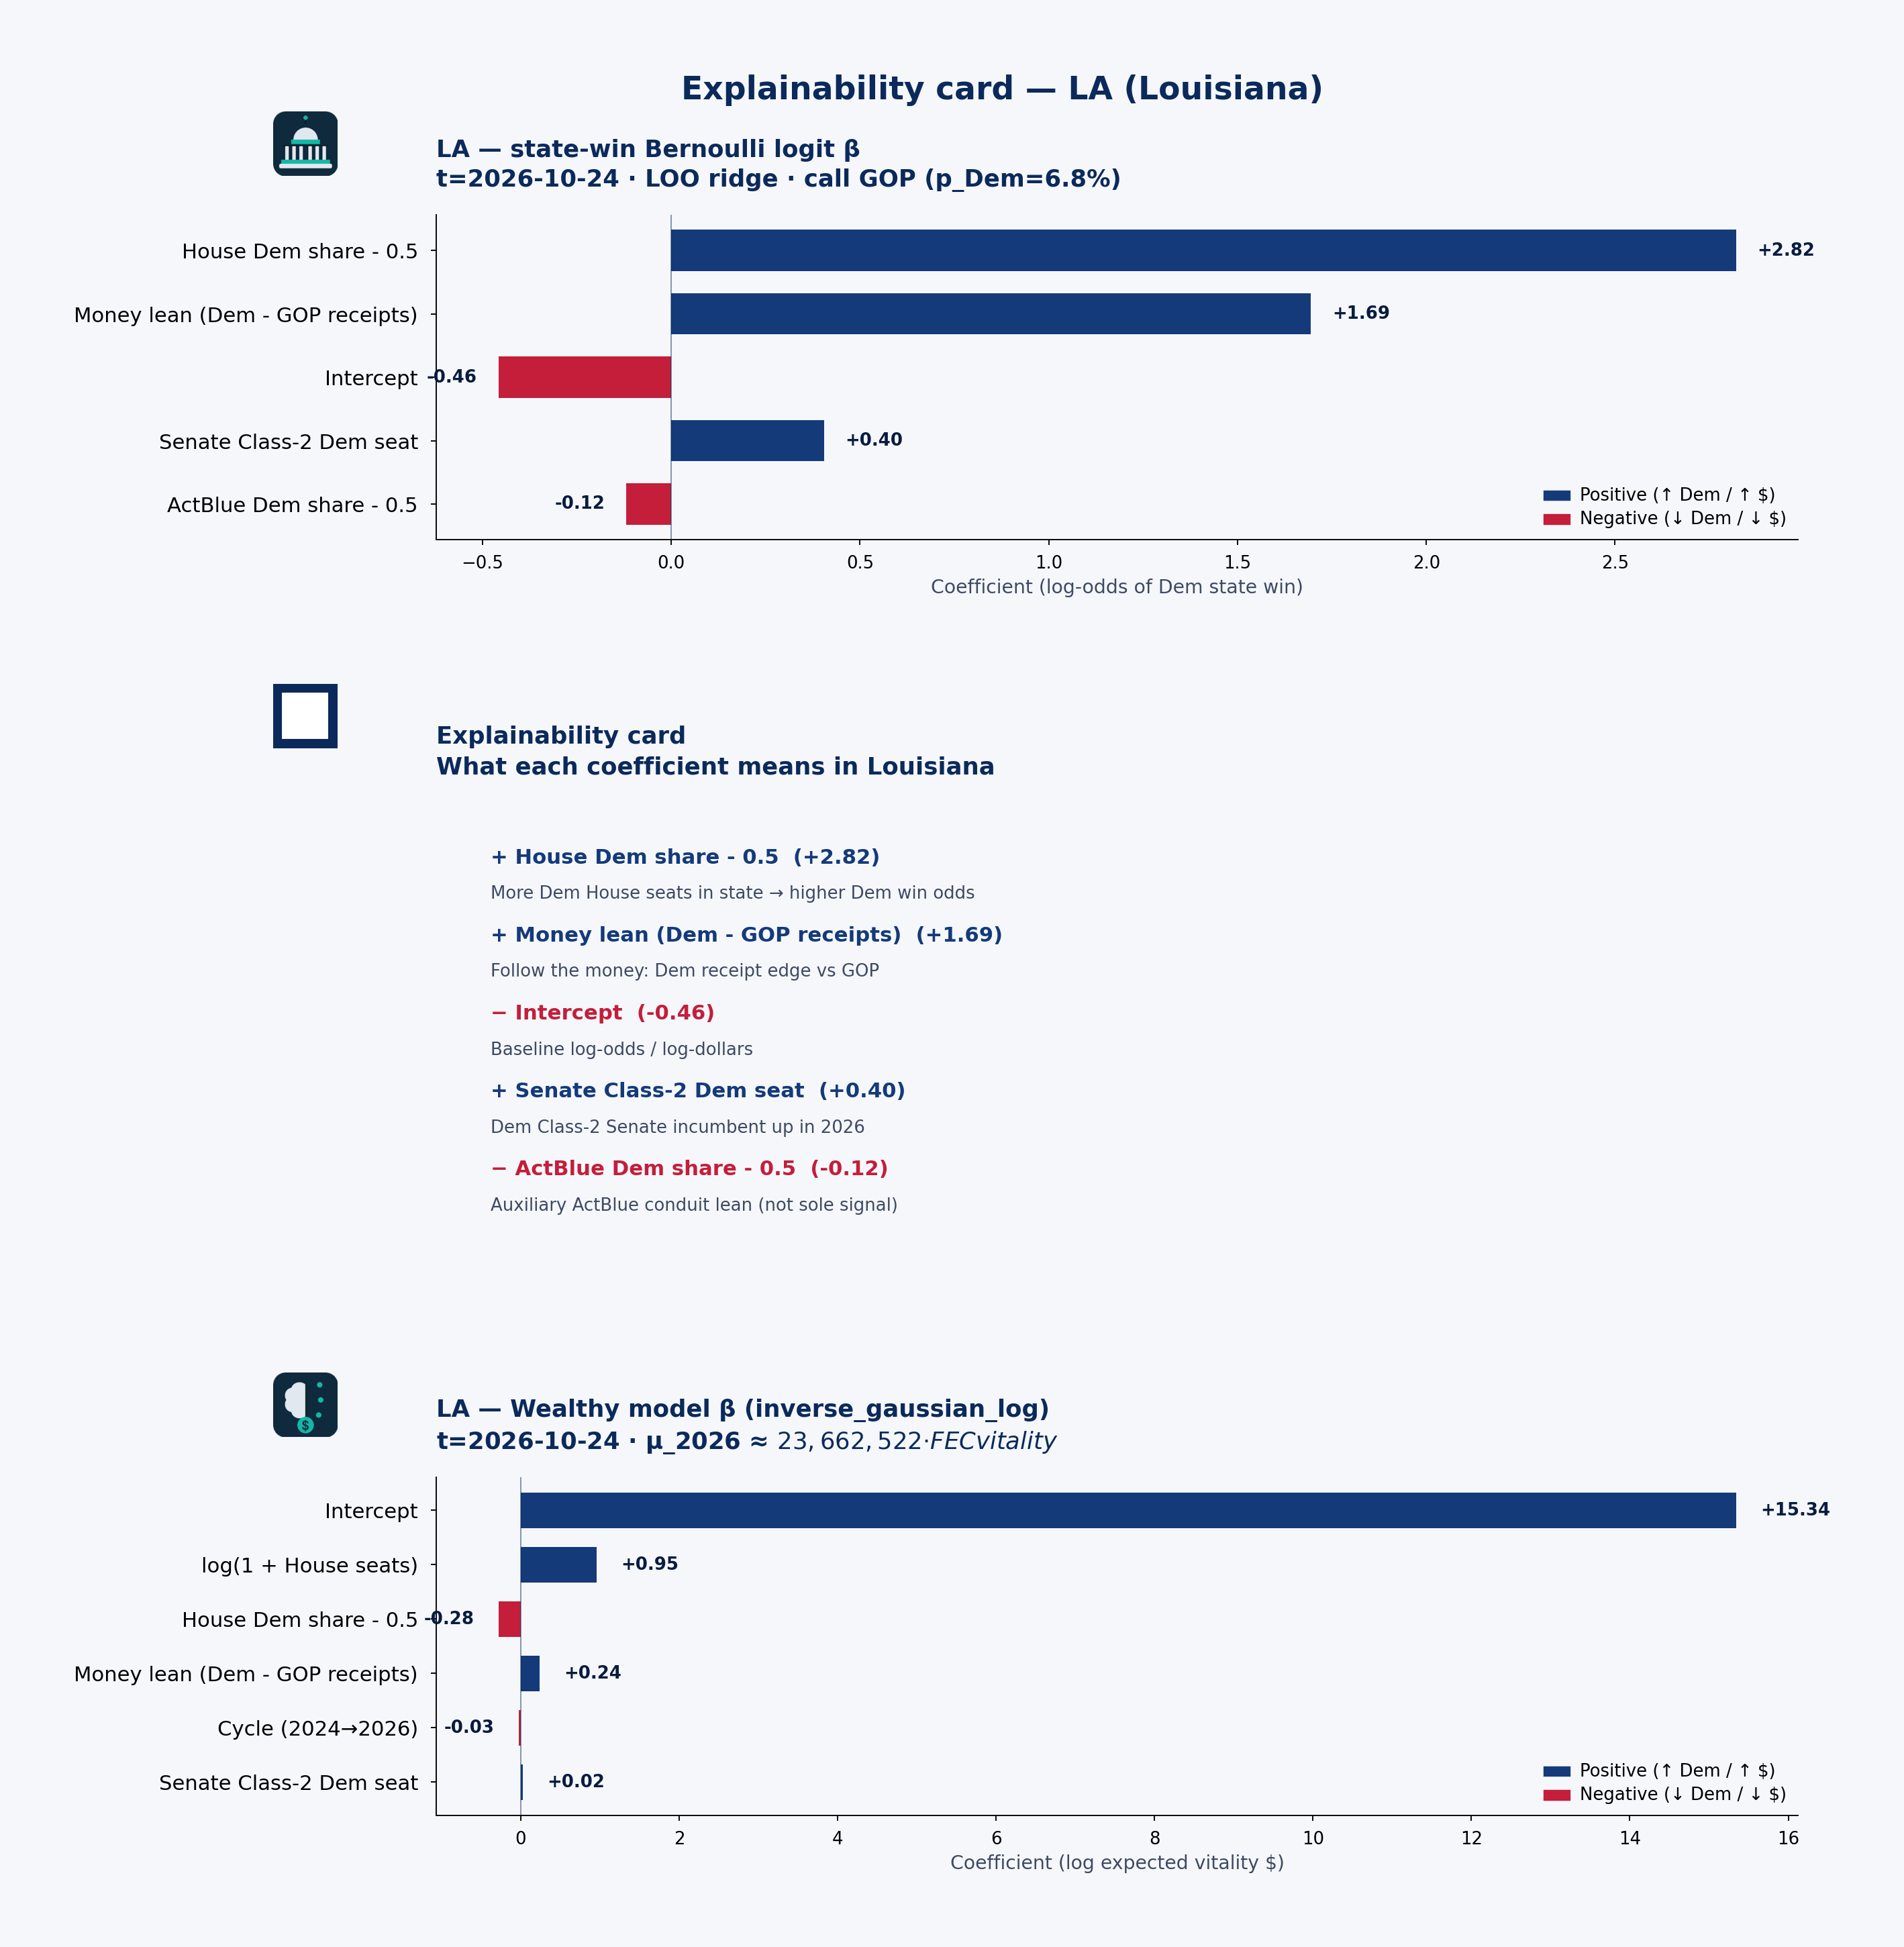 State explainability card · state-win LOO coefficient stability, plain language, and Wealthy model · LA · t=2026-10-24
Statewide call: GOP (p_Dem=7%) · 2026 money shape: individual-heavy
Receipts by cycle (campaign-finance weball)
| Cycle | Candidate | Total receipts | Individual | PAC (other pol. cmte) |
|---|---|---|---|---|
| 2024 | CARTER, TROY A. SR. | $2.04M | $1.10M | $936k |
| 2026 | CARTER, TROY A. SR. | $1.94M | $566k | $1.20M |
| 2024 | CASSIDY, WILLIAM M. | $4.06M | $1.49M | $1.05M |
| 2026 | CASSIDY, WILLIAM M. | $6.70M | $2.18M | $1.74M |
| 2024 | FIELDS, CLEO | $1.25M | $1.11M | $126k |
| 2026 | FIELDS, CLEO | $855k | $661k | $181k |
| 2024 | HIGGINS, CLAY CAPTAIN | $1.03M | $371k | $191k |
| 2026 | HIGGINS, CLAY CAPTAIN | $904k | $235k | $170k |
| 2024 | JOHNSON, JAMES MICHAEL | $19.87M | $10.69M | $1.80M |
| 2026 | JOHNSON, JAMES MICHAEL | $24.58M | $14.02M | $2.09M |
| 2024 | KENNEDY, JOHN NEELY | $15.63M | $13.51M | $96k |
| 2026 | KENNEDY, JOHN NEELY | $11.88M | $10.59M | $120k |
| 2026 | LETLOW, JULIA | $7.06M | $1.57M | $1.24M |
| 2024 | SCALISE, STEVE MR | $14.73M | $2.54M | $187k |
| 2026 | SCALISE, STEVE MR | $11.17M | $1.82M | $208k |
PAC & individual money
PAC money was about $4.38M of $58.60M total receipts in 2024 and $6.95M of $65.10M in 2026. Direct committee→candidate 24K (non-memo) ran about $6.48M (2024) / $9.19M (2026). Itemized individual share from Louisiana: 52.6% (2024) / 48.6% (2026).
JOHNSON, JAMES MICHAEL: Cycle-to-date weball receipts ~$24.58M, with PAC direct 24K $1.97M → $3.10M vs 2024. the public campaign-finance data feed by-size individual totals are not loaded in this 50-state snapshot.
Spotlight candidates
JOHNSON, JAMES MICHAEL
- In 2024, $10.69M of $19.87M came from individuals; PAC (other pol. cmte) $1.80M.
- In 2026, $14.02M of $24.58M came from individuals; PAC (other pol. cmte) $2.09M.
KENNEDY, JOHN NEELY
- In 2024, $13.51M of $15.63M came from individuals; PAC (other pol. cmte) $96k.
- In 2026, $10.59M of $11.88M came from individuals; PAC (other pol. cmte) $120k.
SCALISE, STEVE MR
- In 2024, $2.54M of $14.73M came from individuals; PAC (other pol. cmte) $187k.
- In 2026, $1.82M of $11.17M came from individuals; PAC (other pol. cmte) $208k.
Short talking points — money & predicted voting
Open with the model set’s statewide call: GOP favored at about 7% Dem win probability on public campaign-finance + roster features — not a poll. Then the money shape: Louisiana federal candidates look individual-heavy in 2026 weball (about $6.95M PAC / $31.64M individual of $65.10M total). Spotlight JOHNSON, JAMES MICHAEL for one concrete receipt picture. Close civic: these are public contribution patterns and a transparent forecast model call — not evidence of wrongdoing, and not a substitute for Cook or election-night counts.
MA — Massachusetts
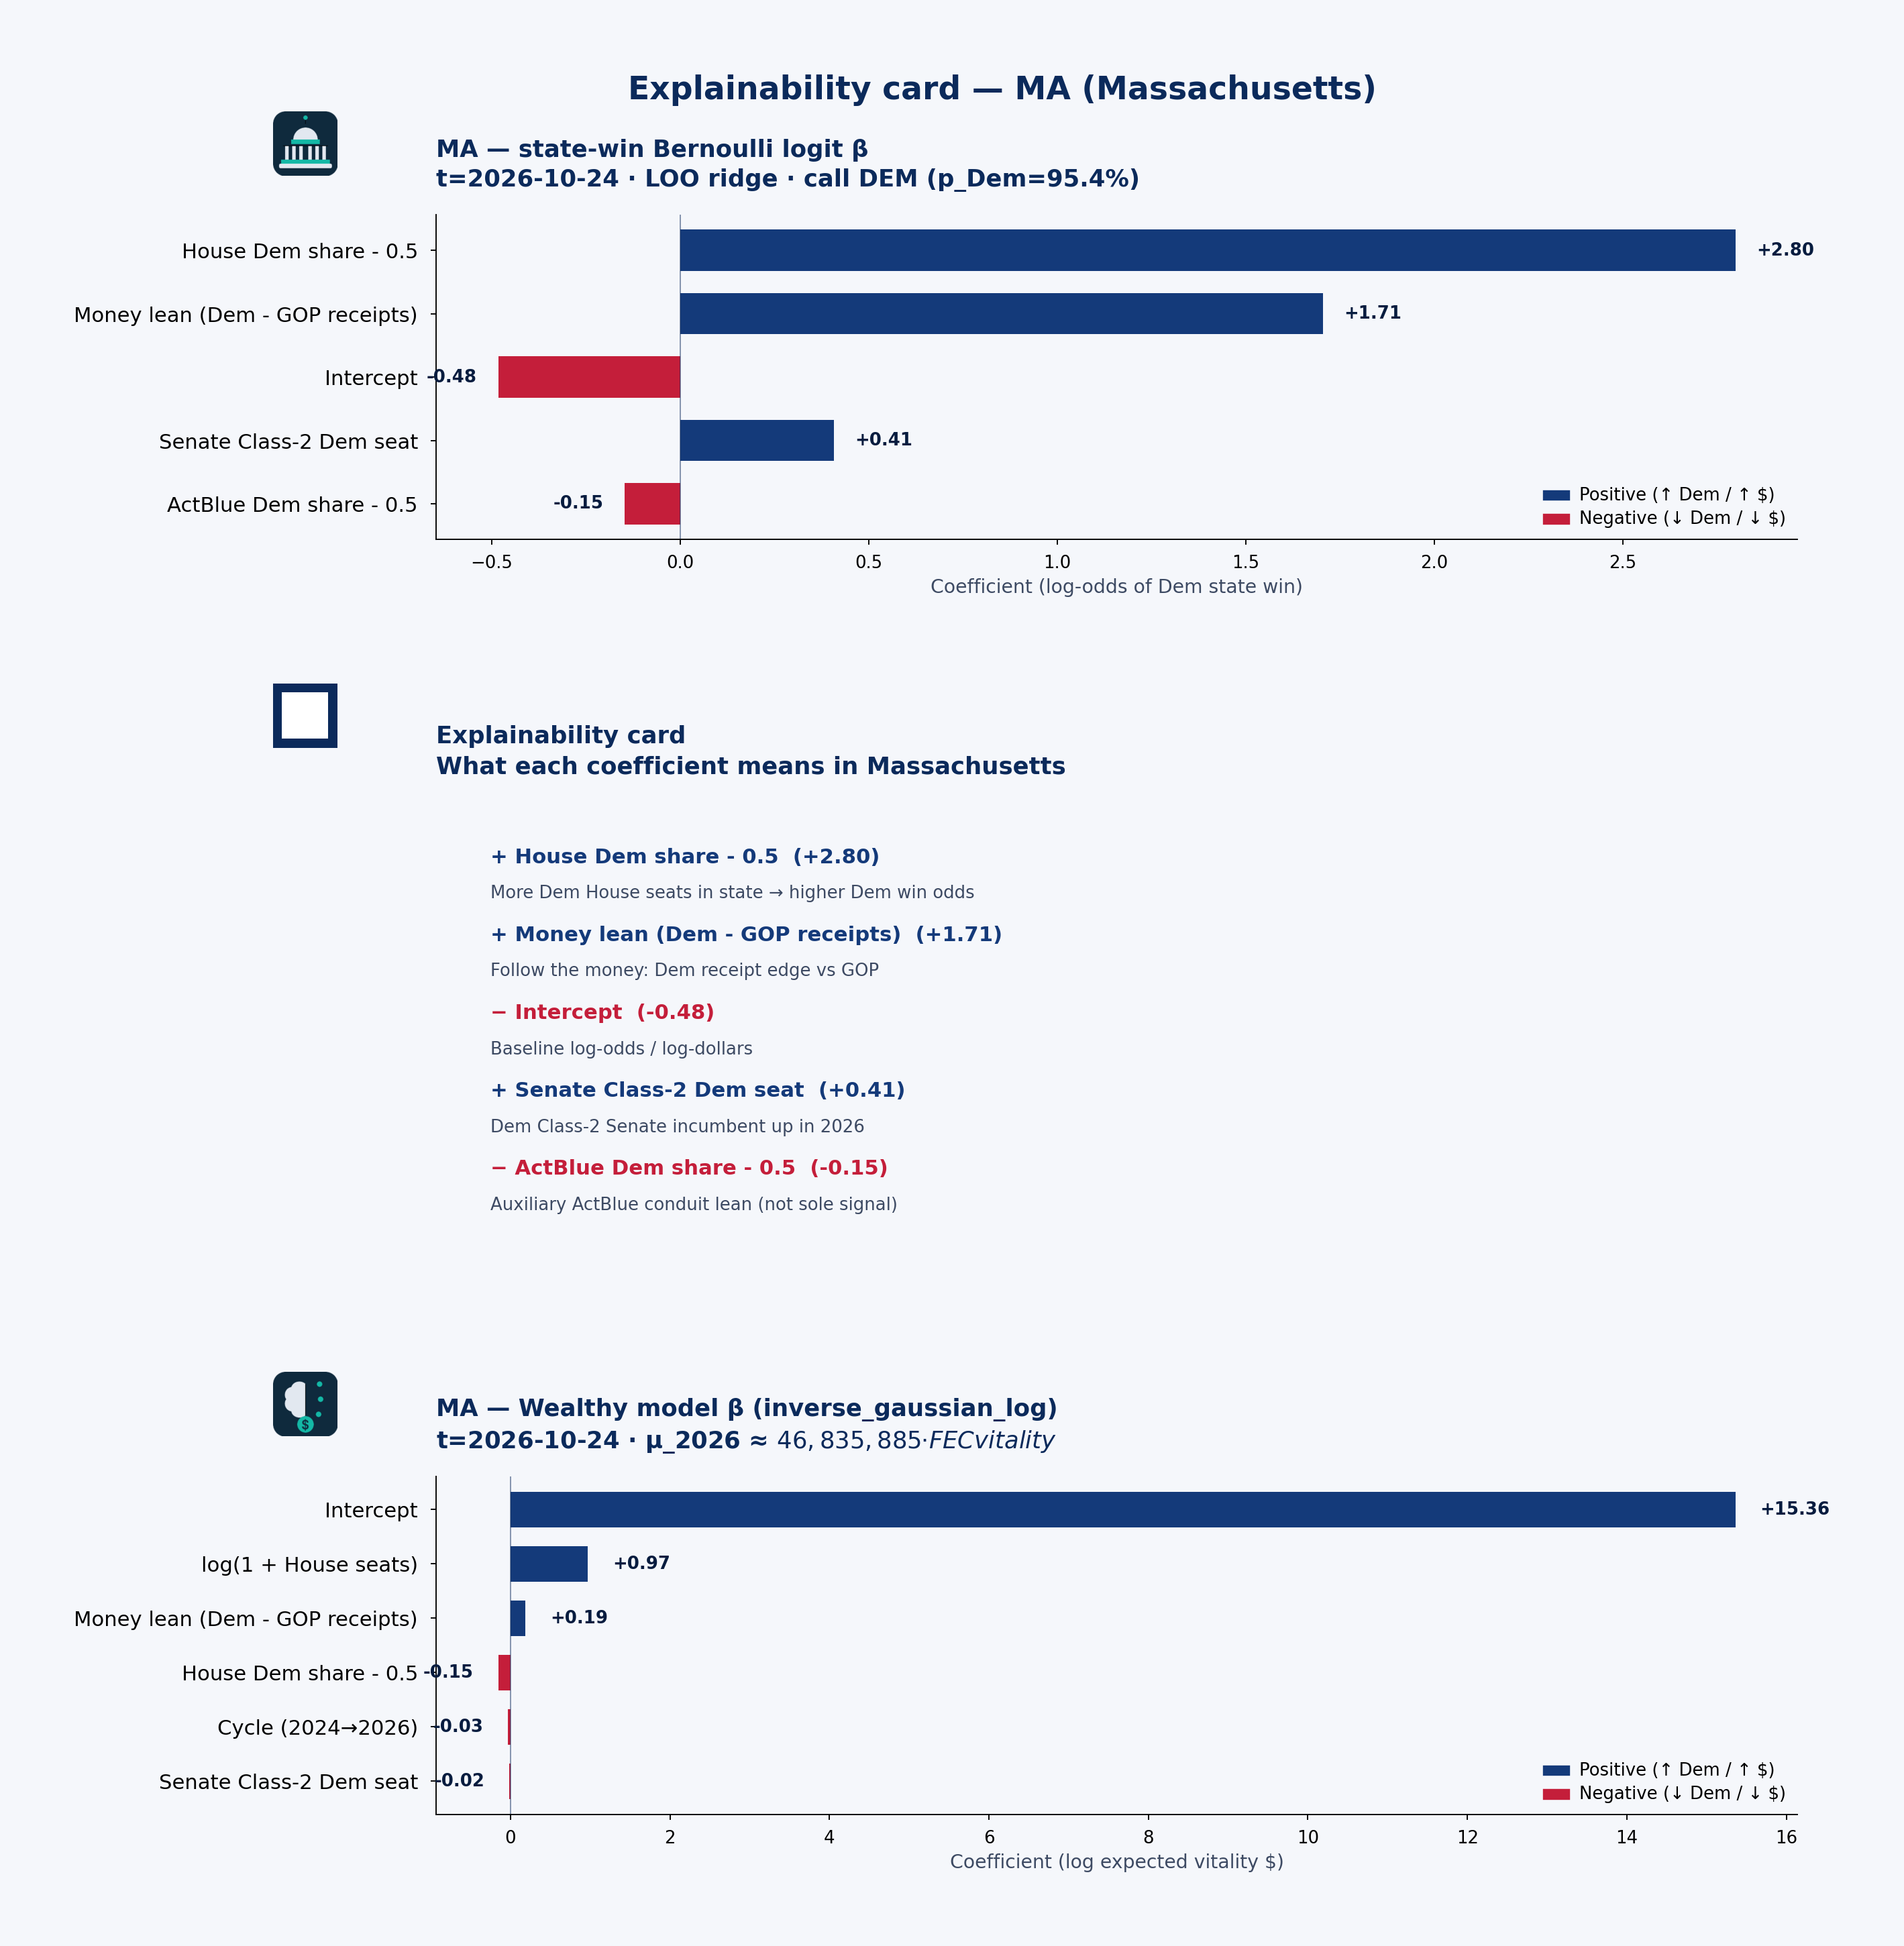 State explainability card · state-win LOO coefficient stability, plain language, and Wealthy model · MA · t=2026-10-24
Statewide call: DEM (p_Dem=95%) · 2026 money shape: balanced
Receipts by cycle (campaign-finance weball)
| Cycle | Candidate | Total receipts | Individual | PAC (other pol. cmte) |
|---|---|---|---|---|
| 2024 | AUCHINCLOSS, JAKE | $3.52M | $2.02M | $510k |
| 2026 | AUCHINCLOSS, JAKE | $3.94M | $2.41M | $897k |
| 2024 | CLARK, KATHERINE | $4.98M | $1.91M | $2.30M |
| 2026 | CLARK, KATHERINE | $5.03M | $1.26M | $2.11M |
| 2024 | MARKEY, EDWARD SEN. | $1.55M | $868k | $98k |
| 2026 | MARKEY, EDWARD SEN. | $5.99M | $2.68M | $681k |
| 2026 | MOULTON, SETH | $6.67M | $6.29M | $259k |
| 2024 | NEAL, RICHARD E | $3.29M | $753k | $2.42M |
| 2026 | NEAL, RICHARD E | $3.11M | $709k | $2.09M |
| 2024 | PRESSLEY, AYANNA | $1.43M | $1.14M | $137k |
| 2026 | PRESSLEY, AYANNA | $1.32M | $1.09M | $93k |
| 2024 | TRAHAN, LORI | $1.77M | $1.08M | $619k |
| 2026 | TRAHAN, LORI | $1.88M | $863k | $991k |
| 2024 | WARREN, ELIZABETH | $9.04M | $8.70M | $60k |
| 2026 | WARREN, ELIZABETH | $4.97M | $4.77M | $25k |
PAC & individual money
PAC money was about $7.25M of $28.06M total receipts in 2024 and $8.11M of $35.51M in 2026. Direct committee→candidate 24K (non-memo) ran about $7.51M (2024) / $7.23M (2026). Itemized individual share from Massachusetts: 63.5% (2024) / 61.1% (2026).
WARREN, ELIZABETH: Cycle-to-date weball receipts ~$4.97M, with PAC direct 24K $80k → $28k vs 2024. the public campaign-finance data feed by-size individual totals $8.89M → $4.58M.
Spotlight candidates
WARREN, ELIZABETH
- In 2024, $8.70M of $9.04M came from individuals; PAC (other pol. cmte) $60k.
- Under-$200 (size 0) was $7.36M in 2024.
- In-state itemized share ~26.9% (2024).
- In 2026, $4.77M of $4.97M came from individuals; PAC (other pol. cmte) $25k.
- Under-$200 (size 0) was $4.09M in 2026.
- In-state itemized share ~26.4% (2026).
MOULTON, SETH
- In 2026, $6.29M of $6.67M came from individuals; PAC (other pol. cmte) $259k.
MARKEY, EDWARD SEN.
- In 2024, $868k of $1.55M came from individuals; PAC (other pol. cmte) $98k.
- Under-$200 (size 0) was $255k in 2024.
- In-state itemized share ~52.3% (2024).
- In 2026, $2.68M of $5.99M came from individuals; PAC (other pol. cmte) $681k.
- Under-$200 (size 0) was $1.23M in 2026.
- In-state itemized share ~44.6% (2026).
Short talking points — money & predicted voting
Open with the model set’s statewide call: DEM favored at about 95% Dem win probability on public campaign-finance + roster features — not a poll. Then the money shape: Massachusetts federal candidates look balanced in 2026 weball (about $8.11M PAC / $21.71M individual of $35.51M total). Spotlight WARREN, ELIZABETH for one concrete receipt picture. Close civic: these are public contribution patterns and a transparent forecast model call — not evidence of wrongdoing, and not a substitute for Cook or election-night counts.
MD — Maryland
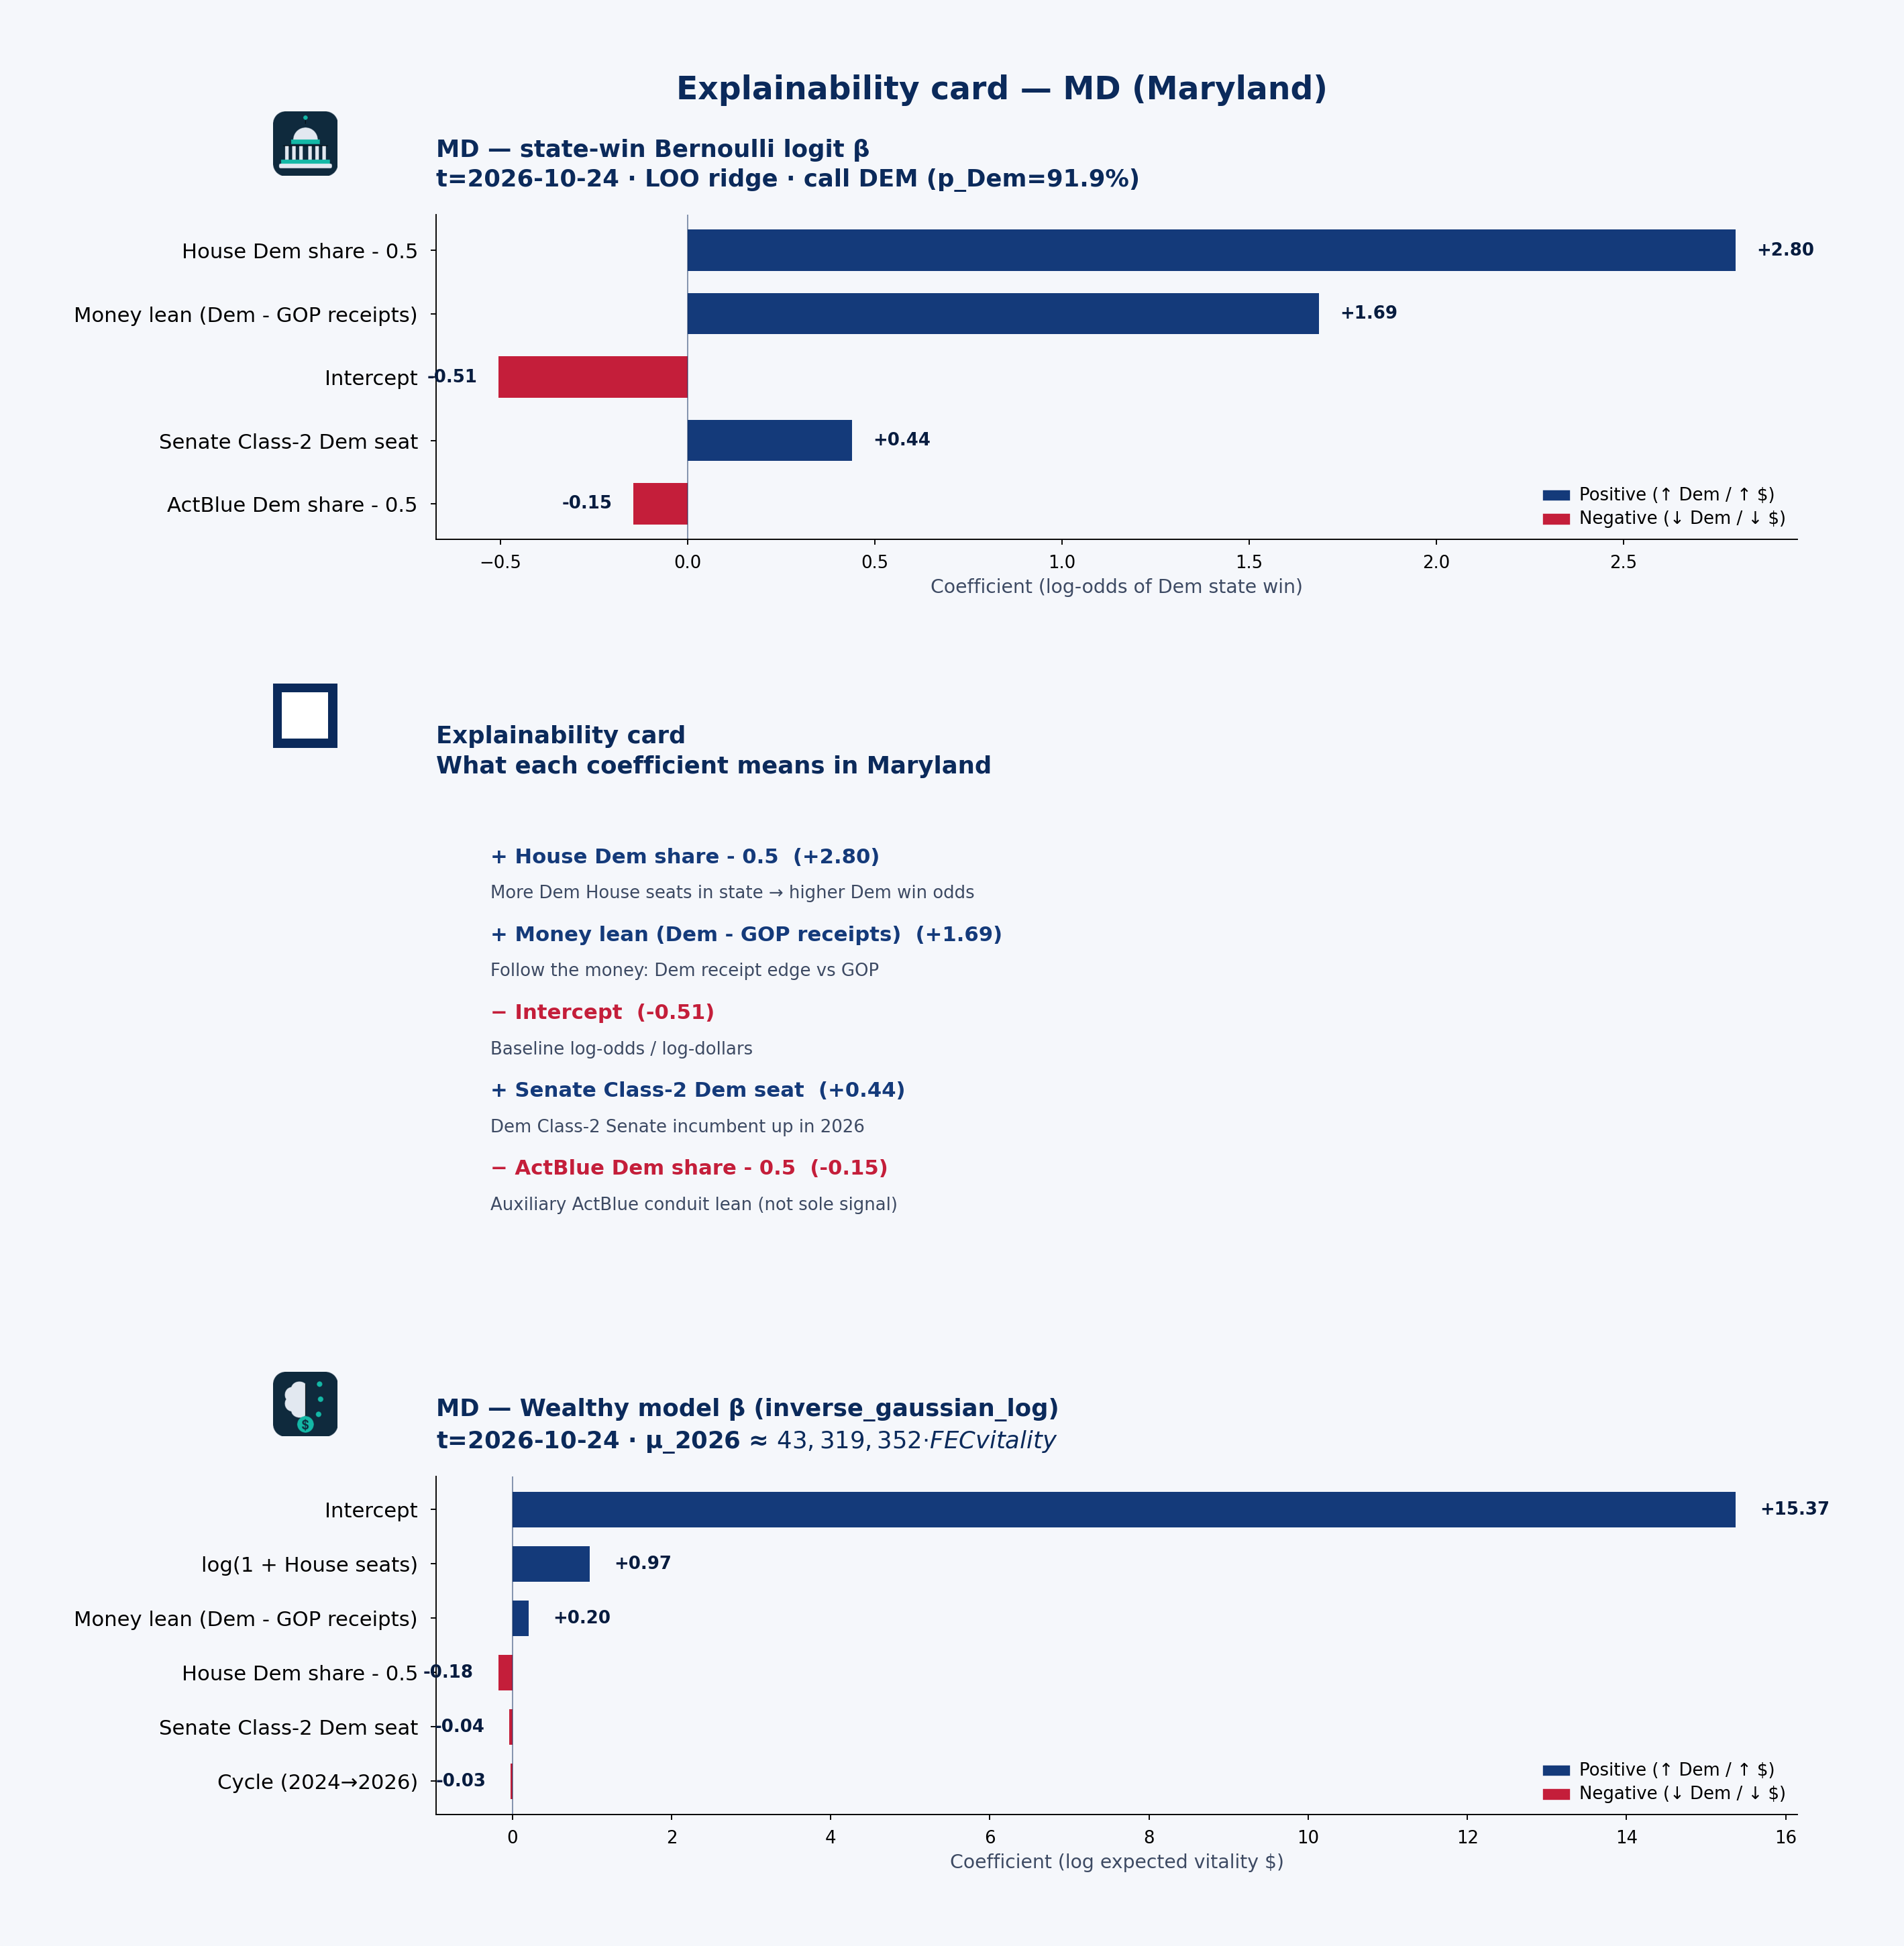 State explainability card · state-win LOO coefficient stability, plain language, and Wealthy model · MD · t=2026-10-24
Statewide call: DEM (p_Dem=92%) · 2026 money shape: individual-heavy
Receipts by cycle (campaign-finance weball)
| Cycle | Candidate | Total receipts | Individual | PAC (other pol. cmte) |
|---|---|---|---|---|
| 2024 | ALSOBROOKS, ANGELA | $31.08M | $23.76M | $1.19M |
| 2026 | ALSOBROOKS, ANGELA | $2.05M | $939k | $520k |
| 2024 | DELANEY, APRIL MCCLAIN | $5.94M | $1.66M | $386k |
| 2026 | DELANEY, APRIL MCCLAIN | $12.54M | $969k | $497k |
| 2024 | ELFRETH, SARAH KELLY | $2.28M | $1.97M | $306k |
| 2026 | ELFRETH, SARAH KELLY | $1.43M | $830k | $593k |
| 2024 | HARRIS, ANDREW P | $1.36M | $824k | $489k |
| 2026 | HARRIS, ANDREW P | $2.70M | $2.12M | $533k |
| 2024 | HOYER, STENY | $1.76M | $466k | $1.04M |
| 2026 | HOYER, STENY | $403k | $128k | $259k |
| 2024 | OLSZEWSKI, JOHN ANTHONY JR. | $1.57M | $1.24M | $311k |
| 2026 | OLSZEWSKI, JOHN ANTHONY JR. | $1.29M | $826k | $454k |
| 2024 | RASKIN, JAMIE | $4.84M | $3.95M | $473k |
| 2026 | RASKIN, JAMIE | $9.32M | $8.22M | $500k |
| 2024 | VAN HOLLEN, CHRIS | $331k | $232k | $44k |
| 2026 | VAN HOLLEN, CHRIS | $2.50M | $1.96M | $84k |
PAC & individual money
PAC money was about $4.59M of $49.69M total receipts in 2024 and $4.21M of $33.60M in 2026. Direct committee→candidate 24K (non-memo) ran about $4.67M (2024) / $3.37M (2026). Itemized individual share from Maryland: 69.0% (2024) / 49.4% (2026).
ALSOBROOKS, ANGELA: Cycle-to-date weball receipts ~$2.05M, with PAC direct 24K $1.29M → $505k vs 2024. the public campaign-finance data feed by-size individual totals are not loaded in this 50-state snapshot.
Spotlight candidates
ALSOBROOKS, ANGELA
- In 2024, $23.76M of $31.08M came from individuals; PAC (other pol. cmte) $1.19M.
- In 2026, $939k of $2.05M came from individuals; PAC (other pol. cmte) $520k.
DELANEY, APRIL MCCLAIN
- In 2024, $1.66M of $5.94M came from individuals; PAC (other pol. cmte) $386k.
- In 2026, $969k of $12.54M came from individuals; PAC (other pol. cmte) $497k.
RASKIN, JAMIE
- In 2024, $3.95M of $4.84M came from individuals; PAC (other pol. cmte) $473k.
- In 2026, $8.22M of $9.32M came from individuals; PAC (other pol. cmte) $500k.
Short talking points — money & predicted voting
Open with the model set’s statewide call: DEM favored at about 92% Dem win probability on public campaign-finance + roster features — not a poll. Then the money shape: Maryland federal candidates look individual-heavy in 2026 weball (about $4.21M PAC / $16.60M individual of $33.60M total). Spotlight ALSOBROOKS, ANGELA for one concrete receipt picture. Close civic: these are public contribution patterns and a transparent forecast model call — not evidence of wrongdoing, and not a substitute for Cook or election-night counts.
ME — Maine
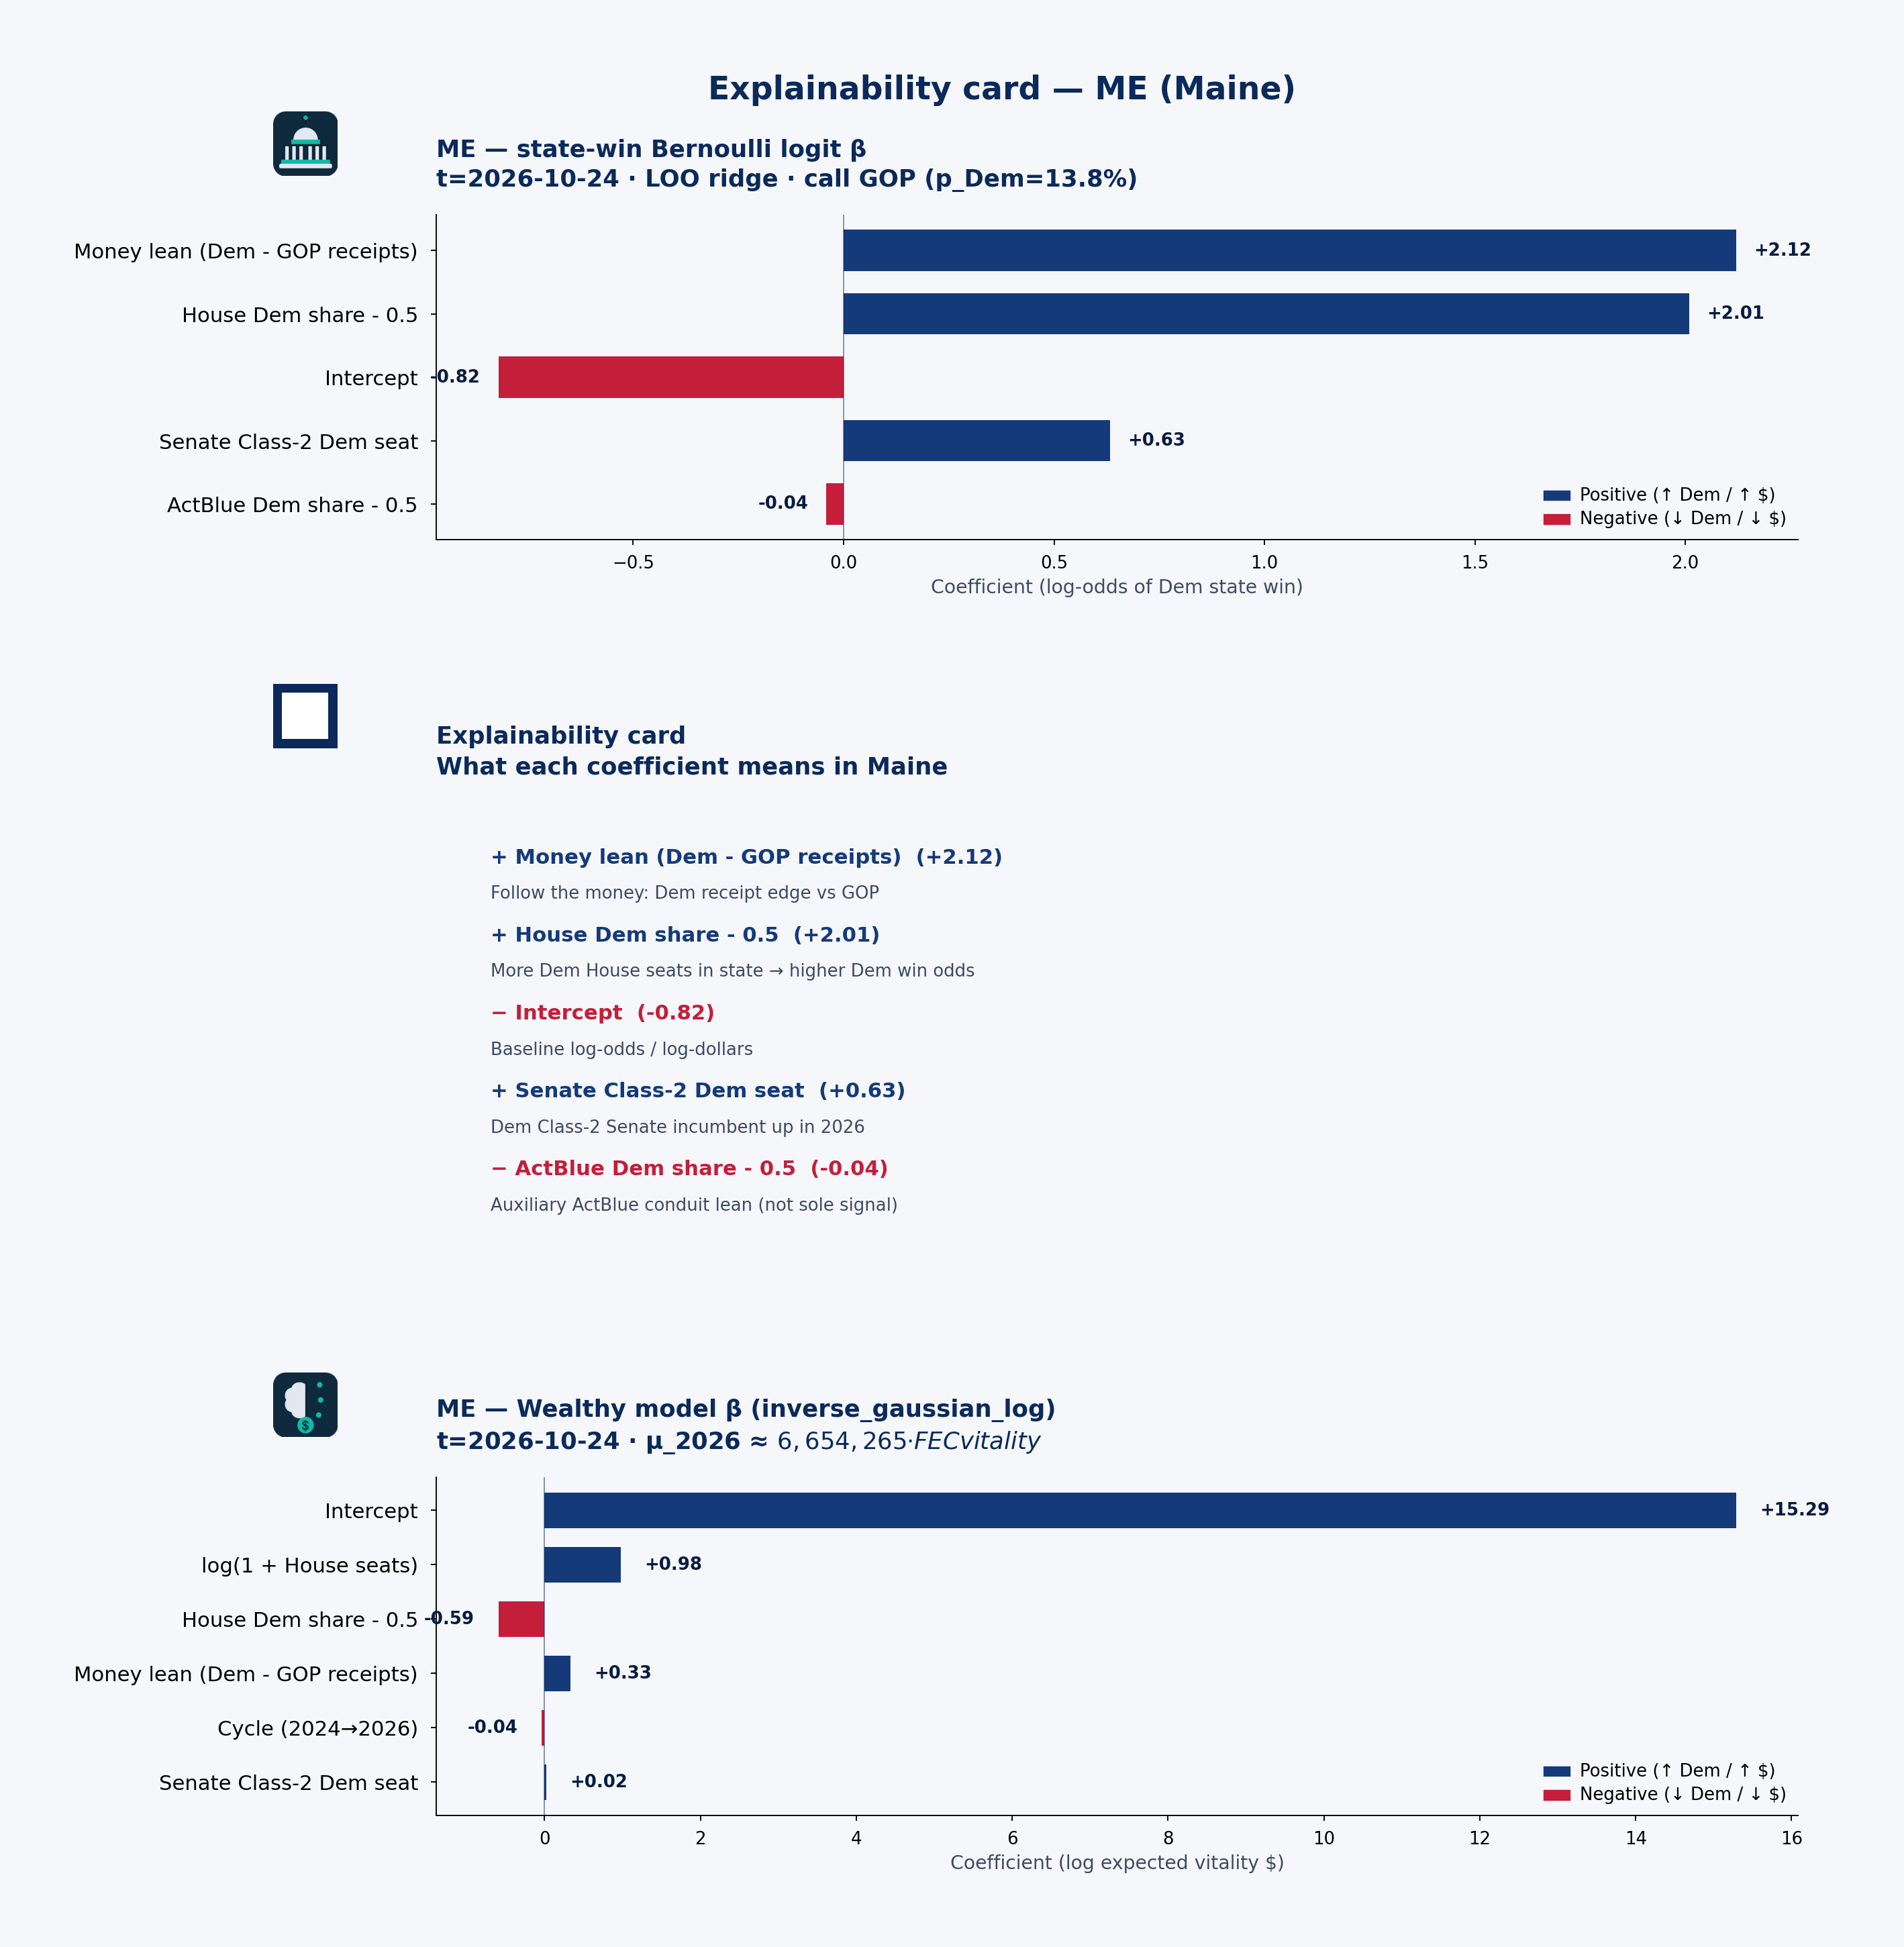 State explainability card · state-win LOO coefficient stability, plain language, and Wealthy model · ME · t=2026-10-24
Statewide call: GOP (p_Dem=14%) · 2026 money shape: individual-heavy
Receipts by cycle (campaign-finance weball)
| Cycle | Candidate | Total receipts | Individual | PAC (other pol. cmte) |
|---|---|---|---|---|
| 2024 | COLLINS, SUSAN M. | $1.62M | $940k | $322k |
| 2026 | COLLINS, SUSAN M. | $22.47M | $15.30M | $1.59M |
| 2024 | GOLDEN, JARED | $7.94M | $6.26M | $1.00M |
| 2026 | GOLDEN, JARED | $2.58M | $1.98M | $319k |
| 2024 | KING, ANGUS S. JR. | $5.37M | $3.73M | $1.50M |
| 2026 | KING, ANGUS S. JR. | $72k | $32k | $34k |
| 2024 | PINGREE, CHELLIE M | $671k | $325k | $331k |
| 2026 | PINGREE, CHELLIE M | $551k | $233k | $306k |
PAC & individual money
PAC money was about $3.16M of $15.61M total receipts in 2024 and $2.25M of $25.67M in 2026. Direct committee→candidate 24K (non-memo) ran about $3.38M (2024) / $3.19M (2026). Itemized individual share from Maine: 72.1% (2024) / 68.3% (2026).
COLLINS, SUSAN M.: Cycle-to-date weball receipts ~$22.47M, with PAC direct 24K $482k → $2.54M vs 2024. the public campaign-finance data feed by-size individual totals are not loaded in this 50-state snapshot.
Spotlight candidates
COLLINS, SUSAN M.
- In 2024, $940k of $1.62M came from individuals; PAC (other pol. cmte) $322k.
- In 2026, $15.30M of $22.47M came from individuals; PAC (other pol. cmte) $1.59M.
GOLDEN, JARED
- In 2024, $6.26M of $7.94M came from individuals; PAC (other pol. cmte) $1.00M.
- In 2026, $1.98M of $2.58M came from individuals; PAC (other pol. cmte) $319k.
KING, ANGUS S. JR.
- In 2024, $3.73M of $5.37M came from individuals; PAC (other pol. cmte) $1.50M.
- In 2026, $32k of $72k came from individuals; PAC (other pol. cmte) $34k.
Short talking points — money & predicted voting
Open with the model set’s statewide call: GOP favored at about 14% Dem win probability on public campaign-finance + roster features — not a poll. Then the money shape: Maine federal candidates look individual-heavy in 2026 weball (about $2.25M PAC / $17.54M individual of $25.67M total). Spotlight COLLINS, SUSAN M. for one concrete receipt picture. Close civic: these are public contribution patterns and a transparent forecast model call — not evidence of wrongdoing, and not a substitute for Cook or election-night counts.
MI — Michigan
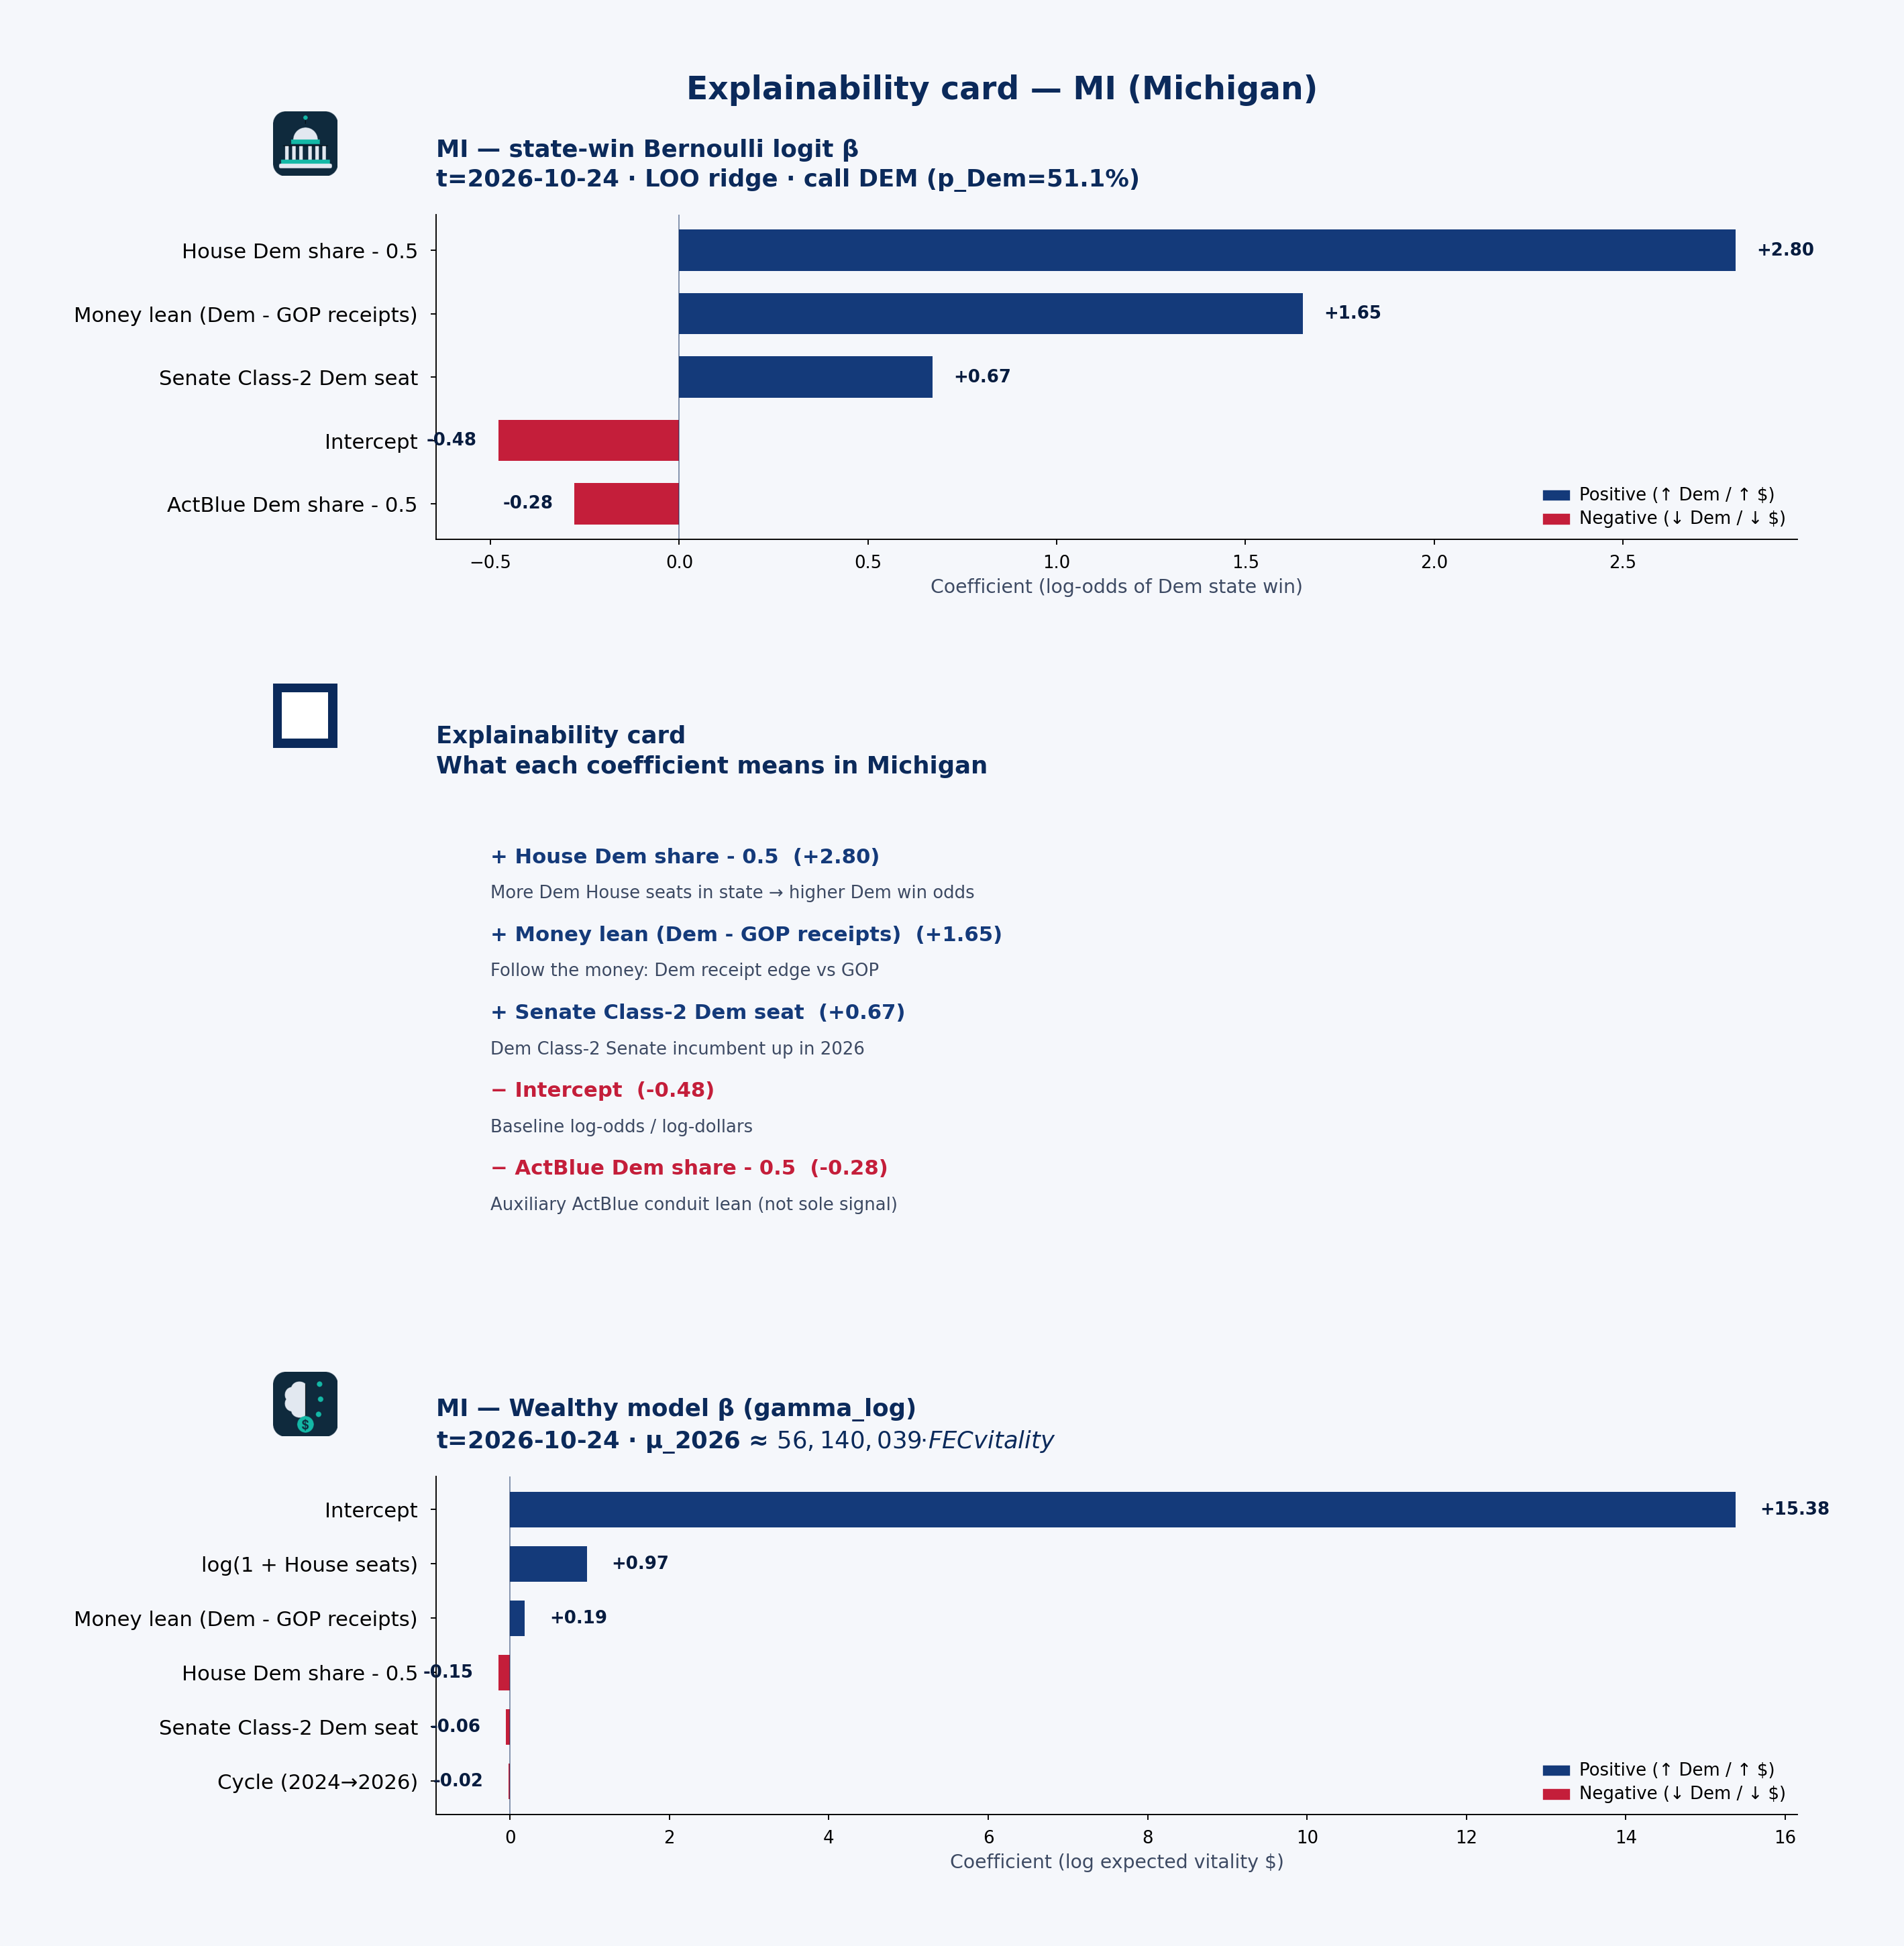 State explainability card · state-win LOO coefficient stability, plain language, and Wealthy model · MI · t=2026-10-24
Statewide call: DEM (p_Dem=51%) · 2026 money shape: individual-heavy
Receipts by cycle (campaign-finance weball)
| Cycle | Candidate | Total receipts | Individual | PAC (other pol. cmte) |
|---|---|---|---|---|
| 2026 | EL-SAYED, ABDUL | $53.83M | $47.20M | $405k |
| 2024 | JAMES, JOHN | $9.55M | $4.65M | $1.32M |
| 2026 | JAMES, JOHN | $554k | $35k | $224k |
| 2026 | MCMORROW, MALLORY | $11.41M | $11.15M | $64k |
| 2024 | ROGERS, MICHAEL J | $13.25M | $9.73M | $957k |
| 2026 | ROGERS, MICHAEL J | $23.02M | $15.43M | $1.29M |
| 2024 | SLOTKIN, ELISSA | $51.94M | $46.59M | $1.20M |
| 2026 | SLOTKIN, ELISSA | $6.02M | $5.65M | $38k |
| 2026 | STEVENS, HALEY | $13.30M | $10.50M | $820k |
| 2024 | THANEDAR, SHRI | $9.66M | $1.07M | $274k |
| 2026 | THANEDAR, SHRI | $3.19M | $907k | $91k |
| 2024 | TLAIB, RASHIDA | $8.47M | $8.10M | $93k |
| 2026 | TLAIB, RASHIDA | $3.26M | $2.75M | $53k |
PAC & individual money
PAC money was about $18.58M of $175.61M total receipts in 2024 and $18.31M of $197.25M in 2026. Direct committee→candidate 24K (non-memo) ran about $18.77M (2024) / $15.09M (2026). Itemized individual share from Michigan: 67.2% (2024) / 74.8% (2026).
EL-SAYED, ABDUL: Cycle-to-date weball receipts ~$53.83M, with PAC direct 24K $0 → $276k vs 2024. the public campaign-finance data feed by-size individual totals are not loaded in this 50-state snapshot.
Spotlight candidates
EL-SAYED, ABDUL
- In 2026, $47.20M of $53.83M came from individuals; PAC (other pol. cmte) $405k.
SLOTKIN, ELISSA
- In 2024, $46.59M of $51.94M came from individuals; PAC (other pol. cmte) $1.20M.
- In 2026, $5.65M of $6.02M came from individuals; PAC (other pol. cmte) $38k.
ROGERS, MICHAEL J
- In 2024, $9.73M of $13.25M came from individuals; PAC (other pol. cmte) $957k.
- In 2026, $15.43M of $23.02M came from individuals; PAC (other pol. cmte) $1.29M.
Short talking points — money & predicted voting
Open with the model set’s statewide call: DEM favored at about 51% Dem win probability on public campaign-finance + roster features — not a poll. Then the money shape: Michigan federal candidates look individual-heavy in 2026 weball (about $18.31M PAC / $147.49M individual of $197.25M total). Spotlight EL-SAYED, ABDUL for one concrete receipt picture. Close civic: these are public contribution patterns and a transparent forecast model call — not evidence of wrongdoing, and not a substitute for Cook or election-night counts.
MN — Minnesota
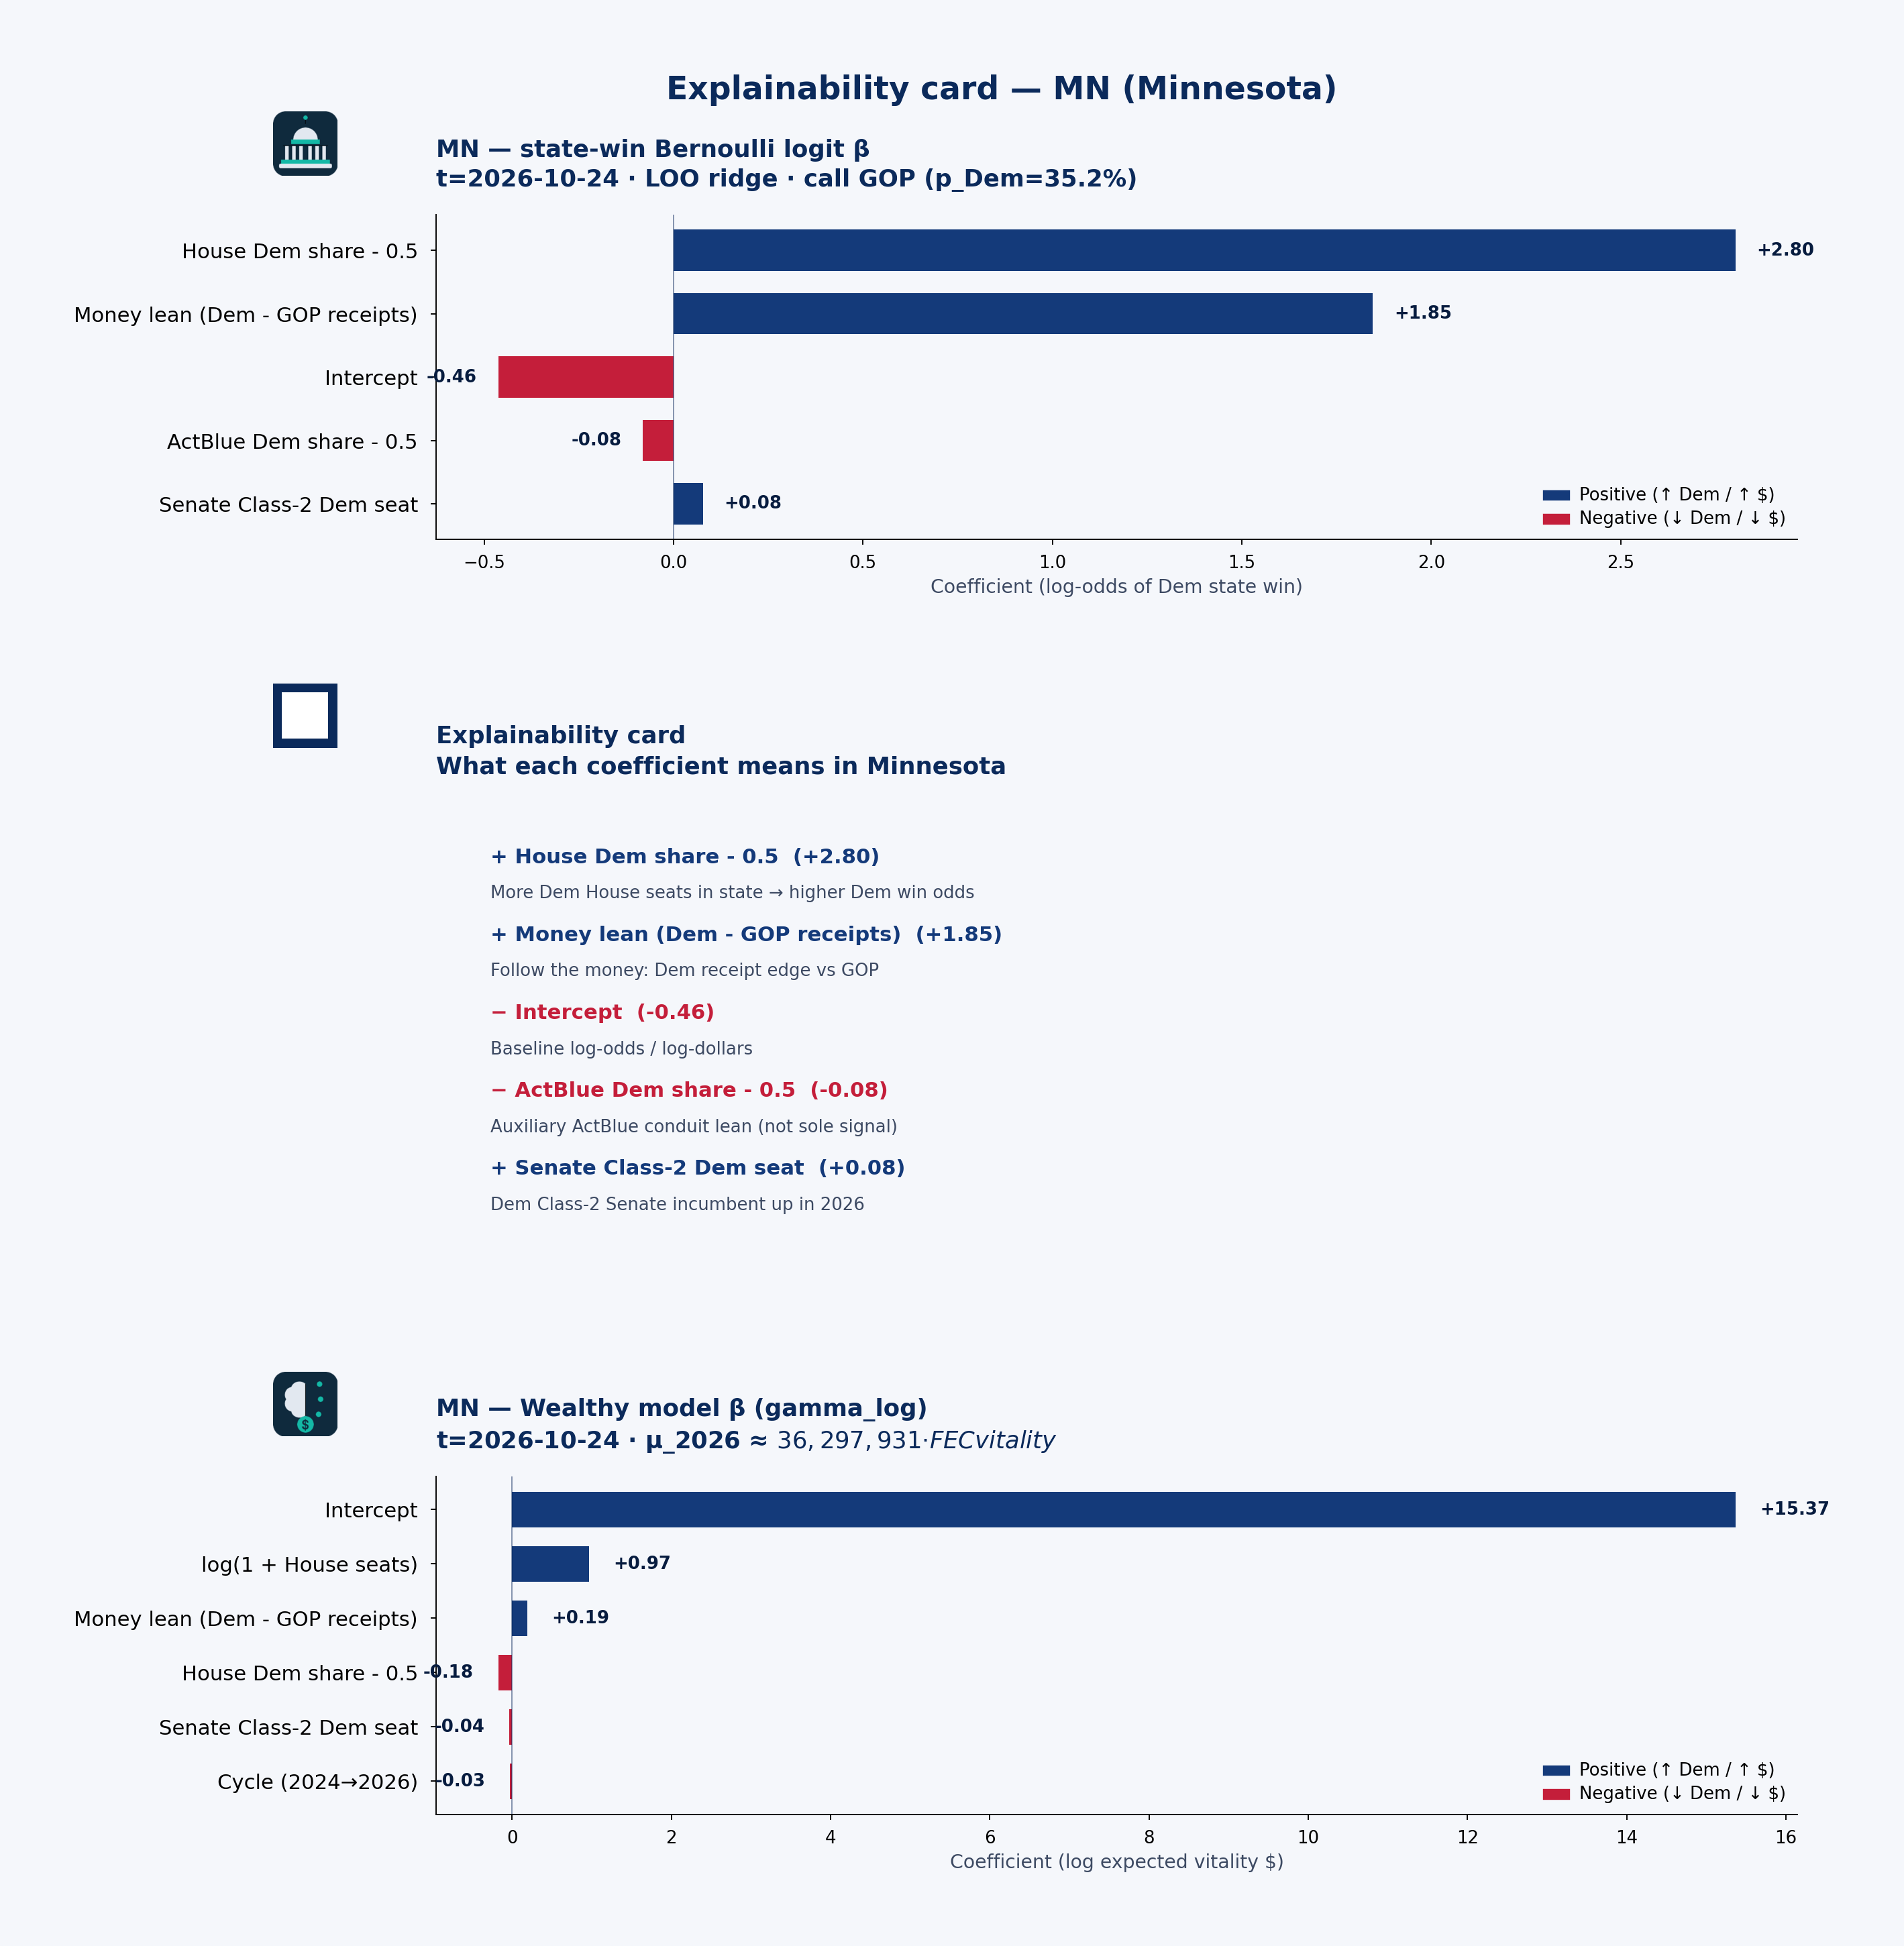 State explainability card · state-win LOO coefficient stability, plain language, and Wealthy model · MN · t=2026-10-24
Statewide call: GOP (p_Dem=35%) · 2026 money shape: balanced
Receipts by cycle (campaign-finance weball)
| Cycle | Candidate | Total receipts | Individual | PAC (other pol. cmte) |
|---|---|---|---|---|
| 2026 | CRAIG, ANGIE | $13.38M | $11.06M | $811k |
| 2024 | EMMER, THOMAS EARL JR. | $8.16M | $2.09M | $2.52M |
| 2026 | EMMER, THOMAS EARL JR. | $10.86M | $3.06M | $2.52M |
| 2024 | FINSTAD, BRAD | $1.98M | $911k | $897k |
| 2026 | FINSTAD, BRAD | $2.77M | $1.03M | $1.36M |
| 2024 | FISCHBACH, MICHELLE | $2.02M | $848k | $1.06M |
| 2026 | FISCHBACH, MICHELLE | $1.67M | $598k | $974k |
| 2024 | KLOBUCHAR, AMY | $14.73M | $10.15M | $1.16M |
| 2026 | KLOBUCHAR, AMY | $2.52M | $1.58M | $159k |
| 2024 | MORRISON, KELLY LOUISE | $2.26M | $1.93M | $285k |
| 2026 | MORRISON, KELLY LOUISE | $1.87M | $1.54M | $312k |
| 2024 | OMAR, ILHAN | $8.34M | $7.95M | $233k |
| 2026 | OMAR, ILHAN | $8.25M | $7.93M | $105k |
| 2024 | STAUBER, PETER ALLEN | $2.28M | $1.25M | $996k |
| 2026 | STAUBER, PETER ALLEN | $2.57M | $1.07M | $1.22M |
PAC & individual money
PAC money was about $8.15M of $43.01M total receipts in 2024 and $8.08M of $45.47M in 2026. Direct committee→candidate 24K (non-memo) ran about $8.17M (2024) / $7.05M (2026). Itemized individual share from Minnesota: 63.6% (2024) / 63.4% (2026).
KLOBUCHAR, AMY: Cycle-to-date weball receipts ~$2.52M, with PAC direct 24K $1.06M → $154k vs 2024. the public campaign-finance data feed by-size individual totals are not loaded in this 50-state snapshot.
Spotlight candidates
KLOBUCHAR, AMY
- In 2024, $10.15M of $14.73M came from individuals; PAC (other pol. cmte) $1.16M.
- In 2026, $1.58M of $2.52M came from individuals; PAC (other pol. cmte) $159k.
CRAIG, ANGIE
- In 2026, $11.06M of $13.38M came from individuals; PAC (other pol. cmte) $811k.
EMMER, THOMAS EARL JR.
- In 2024, $2.09M of $8.16M came from individuals; PAC (other pol. cmte) $2.52M.
- In 2026, $3.06M of $10.86M came from individuals; PAC (other pol. cmte) $2.52M.
Short talking points — money & predicted voting
Open with the model set’s statewide call: GOP favored at about 35% Dem win probability on public campaign-finance + roster features — not a poll. Then the money shape: Minnesota federal candidates look balanced in 2026 weball (about $8.08M PAC / $28.83M individual of $45.47M total). Spotlight KLOBUCHAR, AMY for one concrete receipt picture. Close civic: these are public contribution patterns and a transparent forecast model call — not evidence of wrongdoing, and not a substitute for Cook or election-night counts.
MO — Missouri
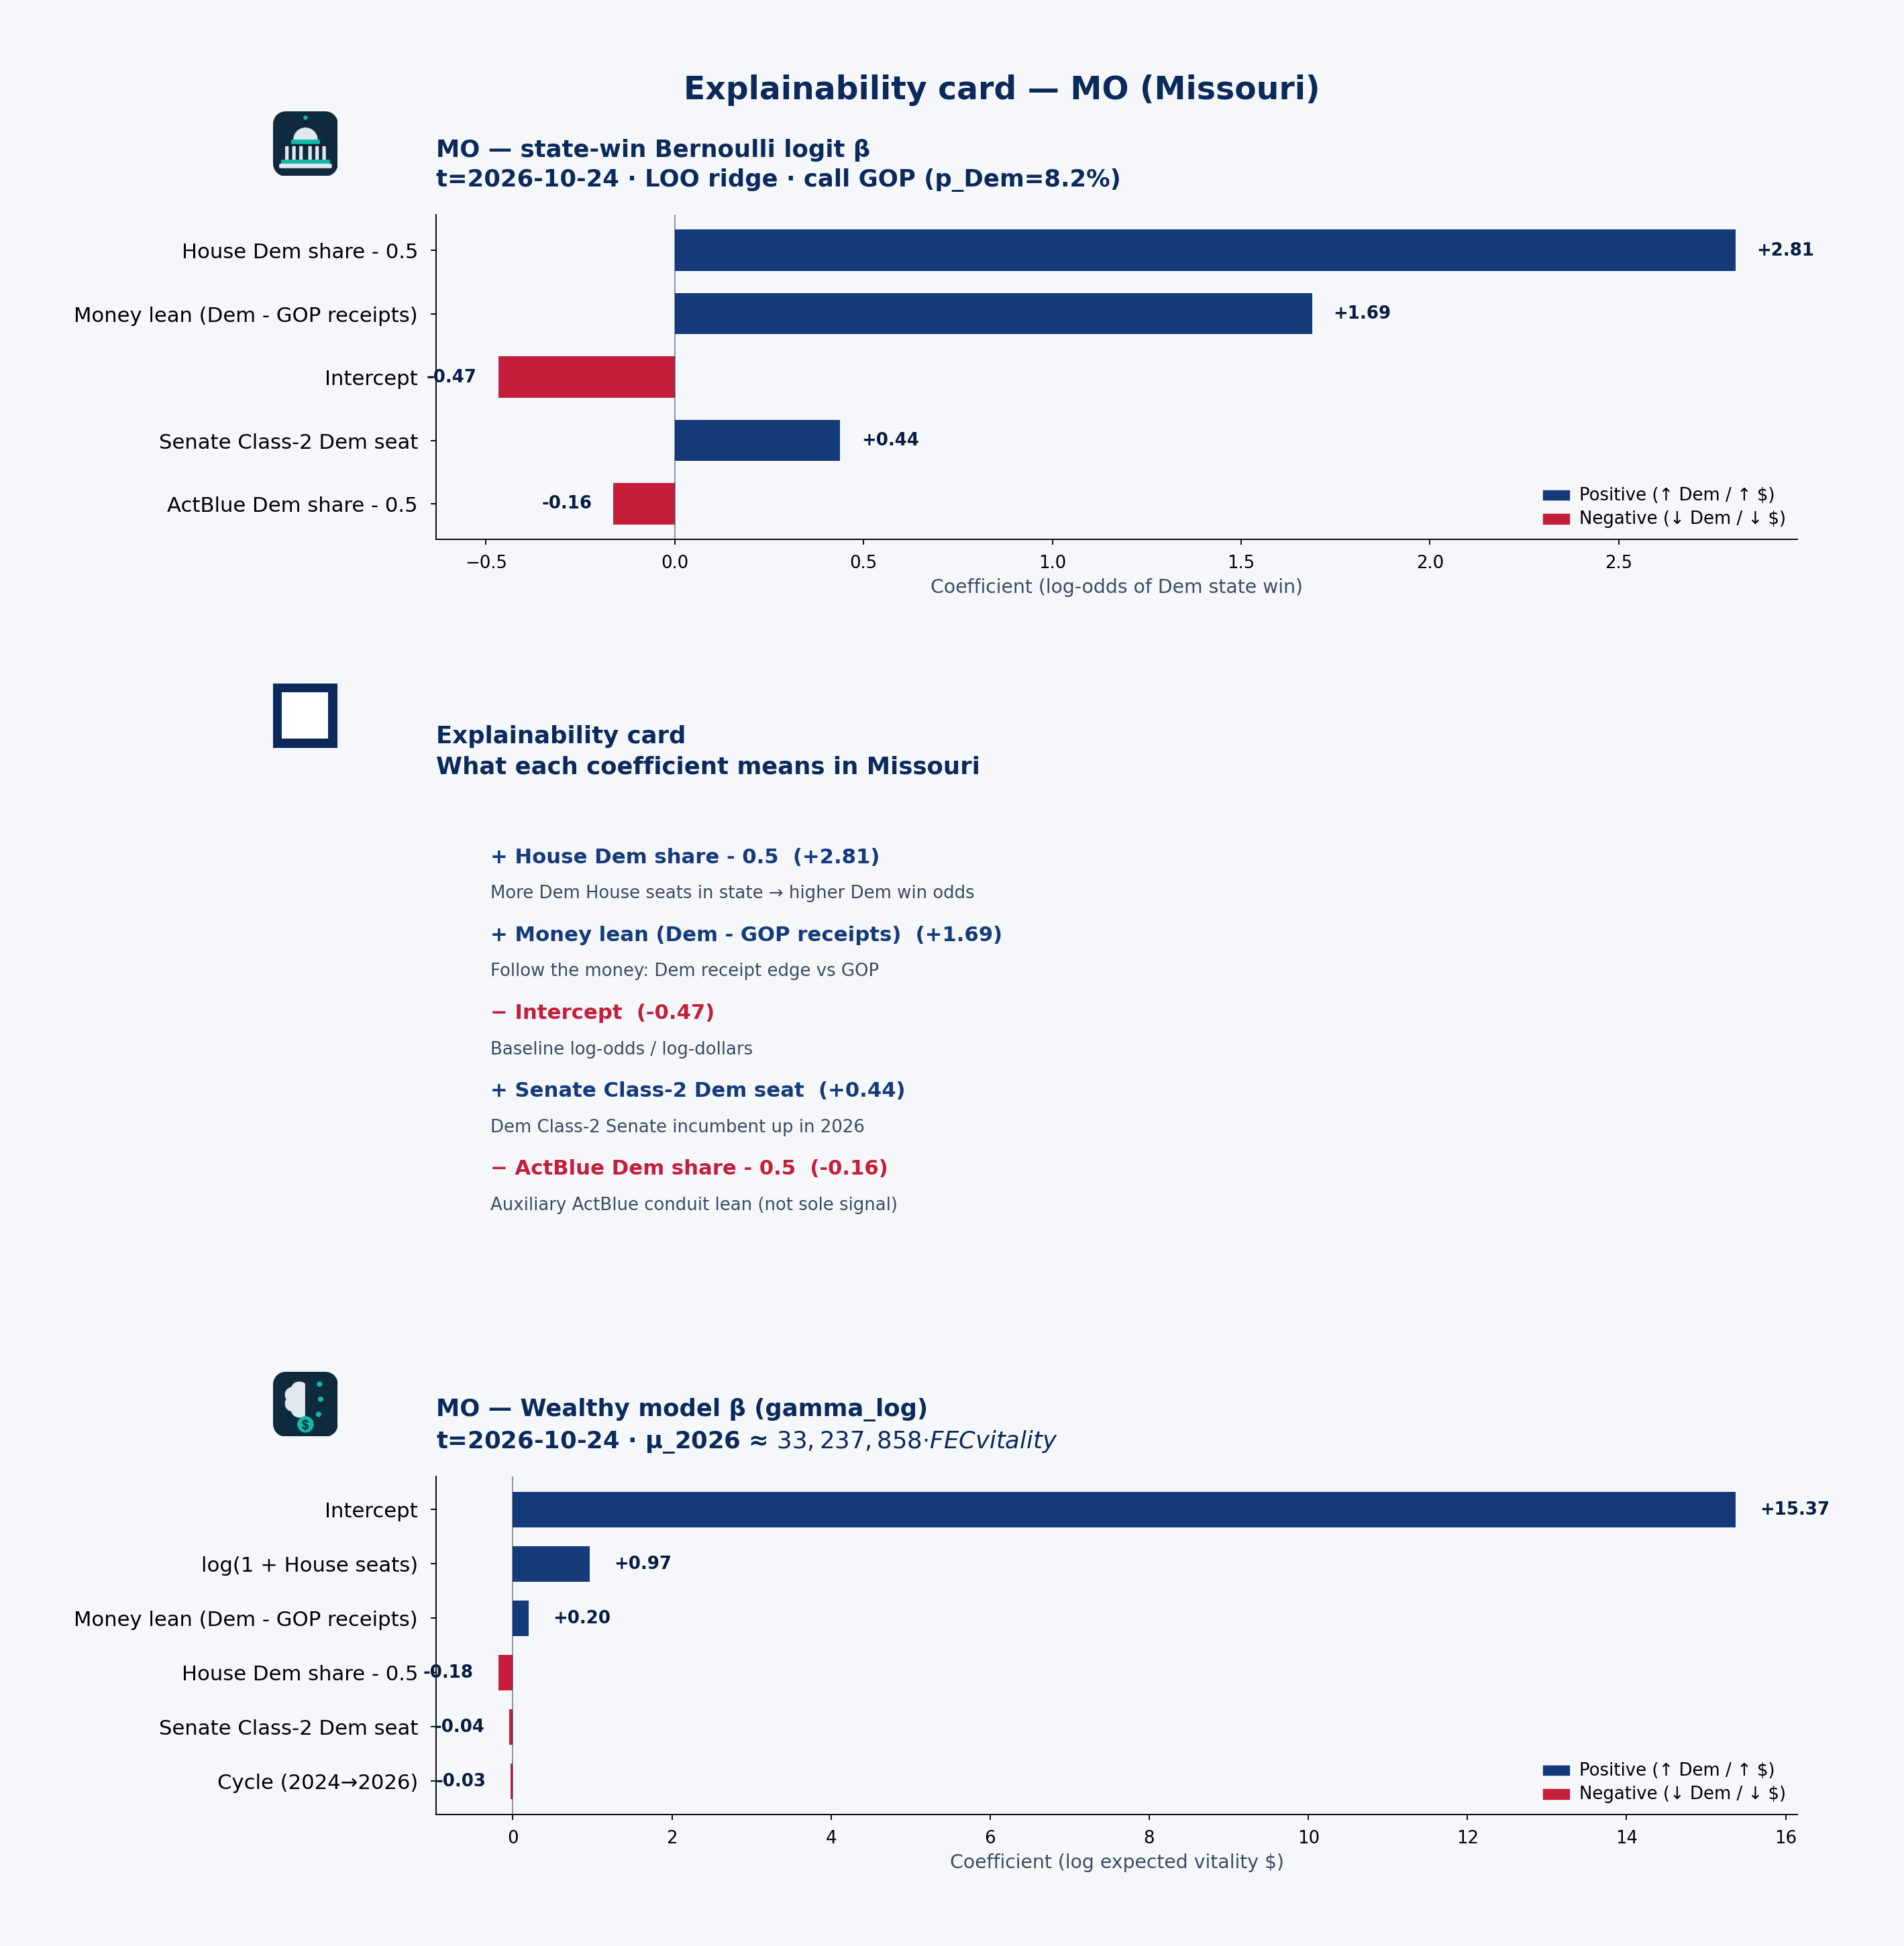 State explainability card · state-win LOO coefficient stability, plain language, and Wealthy model · MO · t=2026-10-24
Statewide call: GOP (p_Dem=8%) · 2026 money shape: balanced
Receipts by cycle (campaign-finance weball)
| Cycle | Candidate | Total receipts | Individual | PAC (other pol. cmte) |
|---|---|---|---|---|
| 2024 | BELL, WESLEY | $5.39M | $5.14M | $245k |
| 2026 | BELL, WESLEY | $4.02M | $3.22M | $707k |
| 2026 | CLEAVER II, EMANUEL | $1.77M | $717k | $1.05M |
| 2024 | CLEAVER, EMANUEL II | $1.39M | $463k | $923k |
| 2024 | GRAVES, SAMUEL B. JR. | $2.79M | $866k | $1.76M |
| 2026 | GRAVES, SAMUEL B. JR. | $1.82M | $403k | $1.09M |
| 2024 | HAWLEY, JOSHUA DAVID SEN | $13.81M | $6.98M | $398k |
| 2026 | HAWLEY, JOSHUA DAVID SEN | $1.91M | $334k | $31k |
| 2026 | ONDER JR, ROBERT FRANK | $1.15M | $552k | $518k |
| 2024 | ONDER, ROBERT FRANK JR | $1.78M | $655k | $222k |
| 2024 | SCHMITT, ERIC | $1.96M | $1.25M | $442k |
| 2026 | SCHMITT, ERIC | $4.18M | $3.00M | $270k |
| 2024 | SMITH, JASON T | $6.55M | $2.29M | $3.48M |
| 2026 | SMITH, JASON T | $6.30M | $1.85M | $3.34M |
| 2024 | WAGNER, ANN L. | $4.33M | $2.59M | $1.66M |
| 2026 | WAGNER, ANN L. | $4.19M | $2.35M | $1.44M |
PAC & individual money
PAC money was about $10.15M of $40.21M total receipts in 2024 and $9.45M of $28.63M in 2026. Direct committee→candidate 24K (non-memo) ran about $10.25M (2024) / $7.77M (2026). Itemized individual share from Missouri: 52.9% (2024) / 51.1% (2026).
HAWLEY, JOSHUA DAVID SEN: Cycle-to-date weball receipts ~$1.91M, with PAC direct 24K $558k → $80k vs 2024. the public campaign-finance data feed by-size individual totals are not loaded in this 50-state snapshot.
Spotlight candidates
HAWLEY, JOSHUA DAVID SEN
- In 2024, $6.98M of $13.81M came from individuals; PAC (other pol. cmte) $398k.
- In 2026, $334k of $1.91M came from individuals; PAC (other pol. cmte) $31k.
SMITH, JASON T
- In 2024, $2.29M of $6.55M came from individuals; PAC (other pol. cmte) $3.48M.
- In 2026, $1.85M of $6.30M came from individuals; PAC (other pol. cmte) $3.34M.
BELL, WESLEY
- In 2024, $5.14M of $5.39M came from individuals; PAC (other pol. cmte) $245k.
- In 2026, $3.22M of $4.02M came from individuals; PAC (other pol. cmte) $707k.
Short talking points — money & predicted voting
Open with the model set’s statewide call: GOP favored at about 8% Dem win probability on public campaign-finance + roster features — not a poll. Then the money shape: Missouri federal candidates look balanced in 2026 weball (about $9.45M PAC / $14.62M individual of $28.63M total). Spotlight HAWLEY, JOSHUA DAVID SEN for one concrete receipt picture. Close civic: these are public contribution patterns and a transparent forecast model call — not evidence of wrongdoing, and not a substitute for Cook or election-night counts.
MS — Mississippi
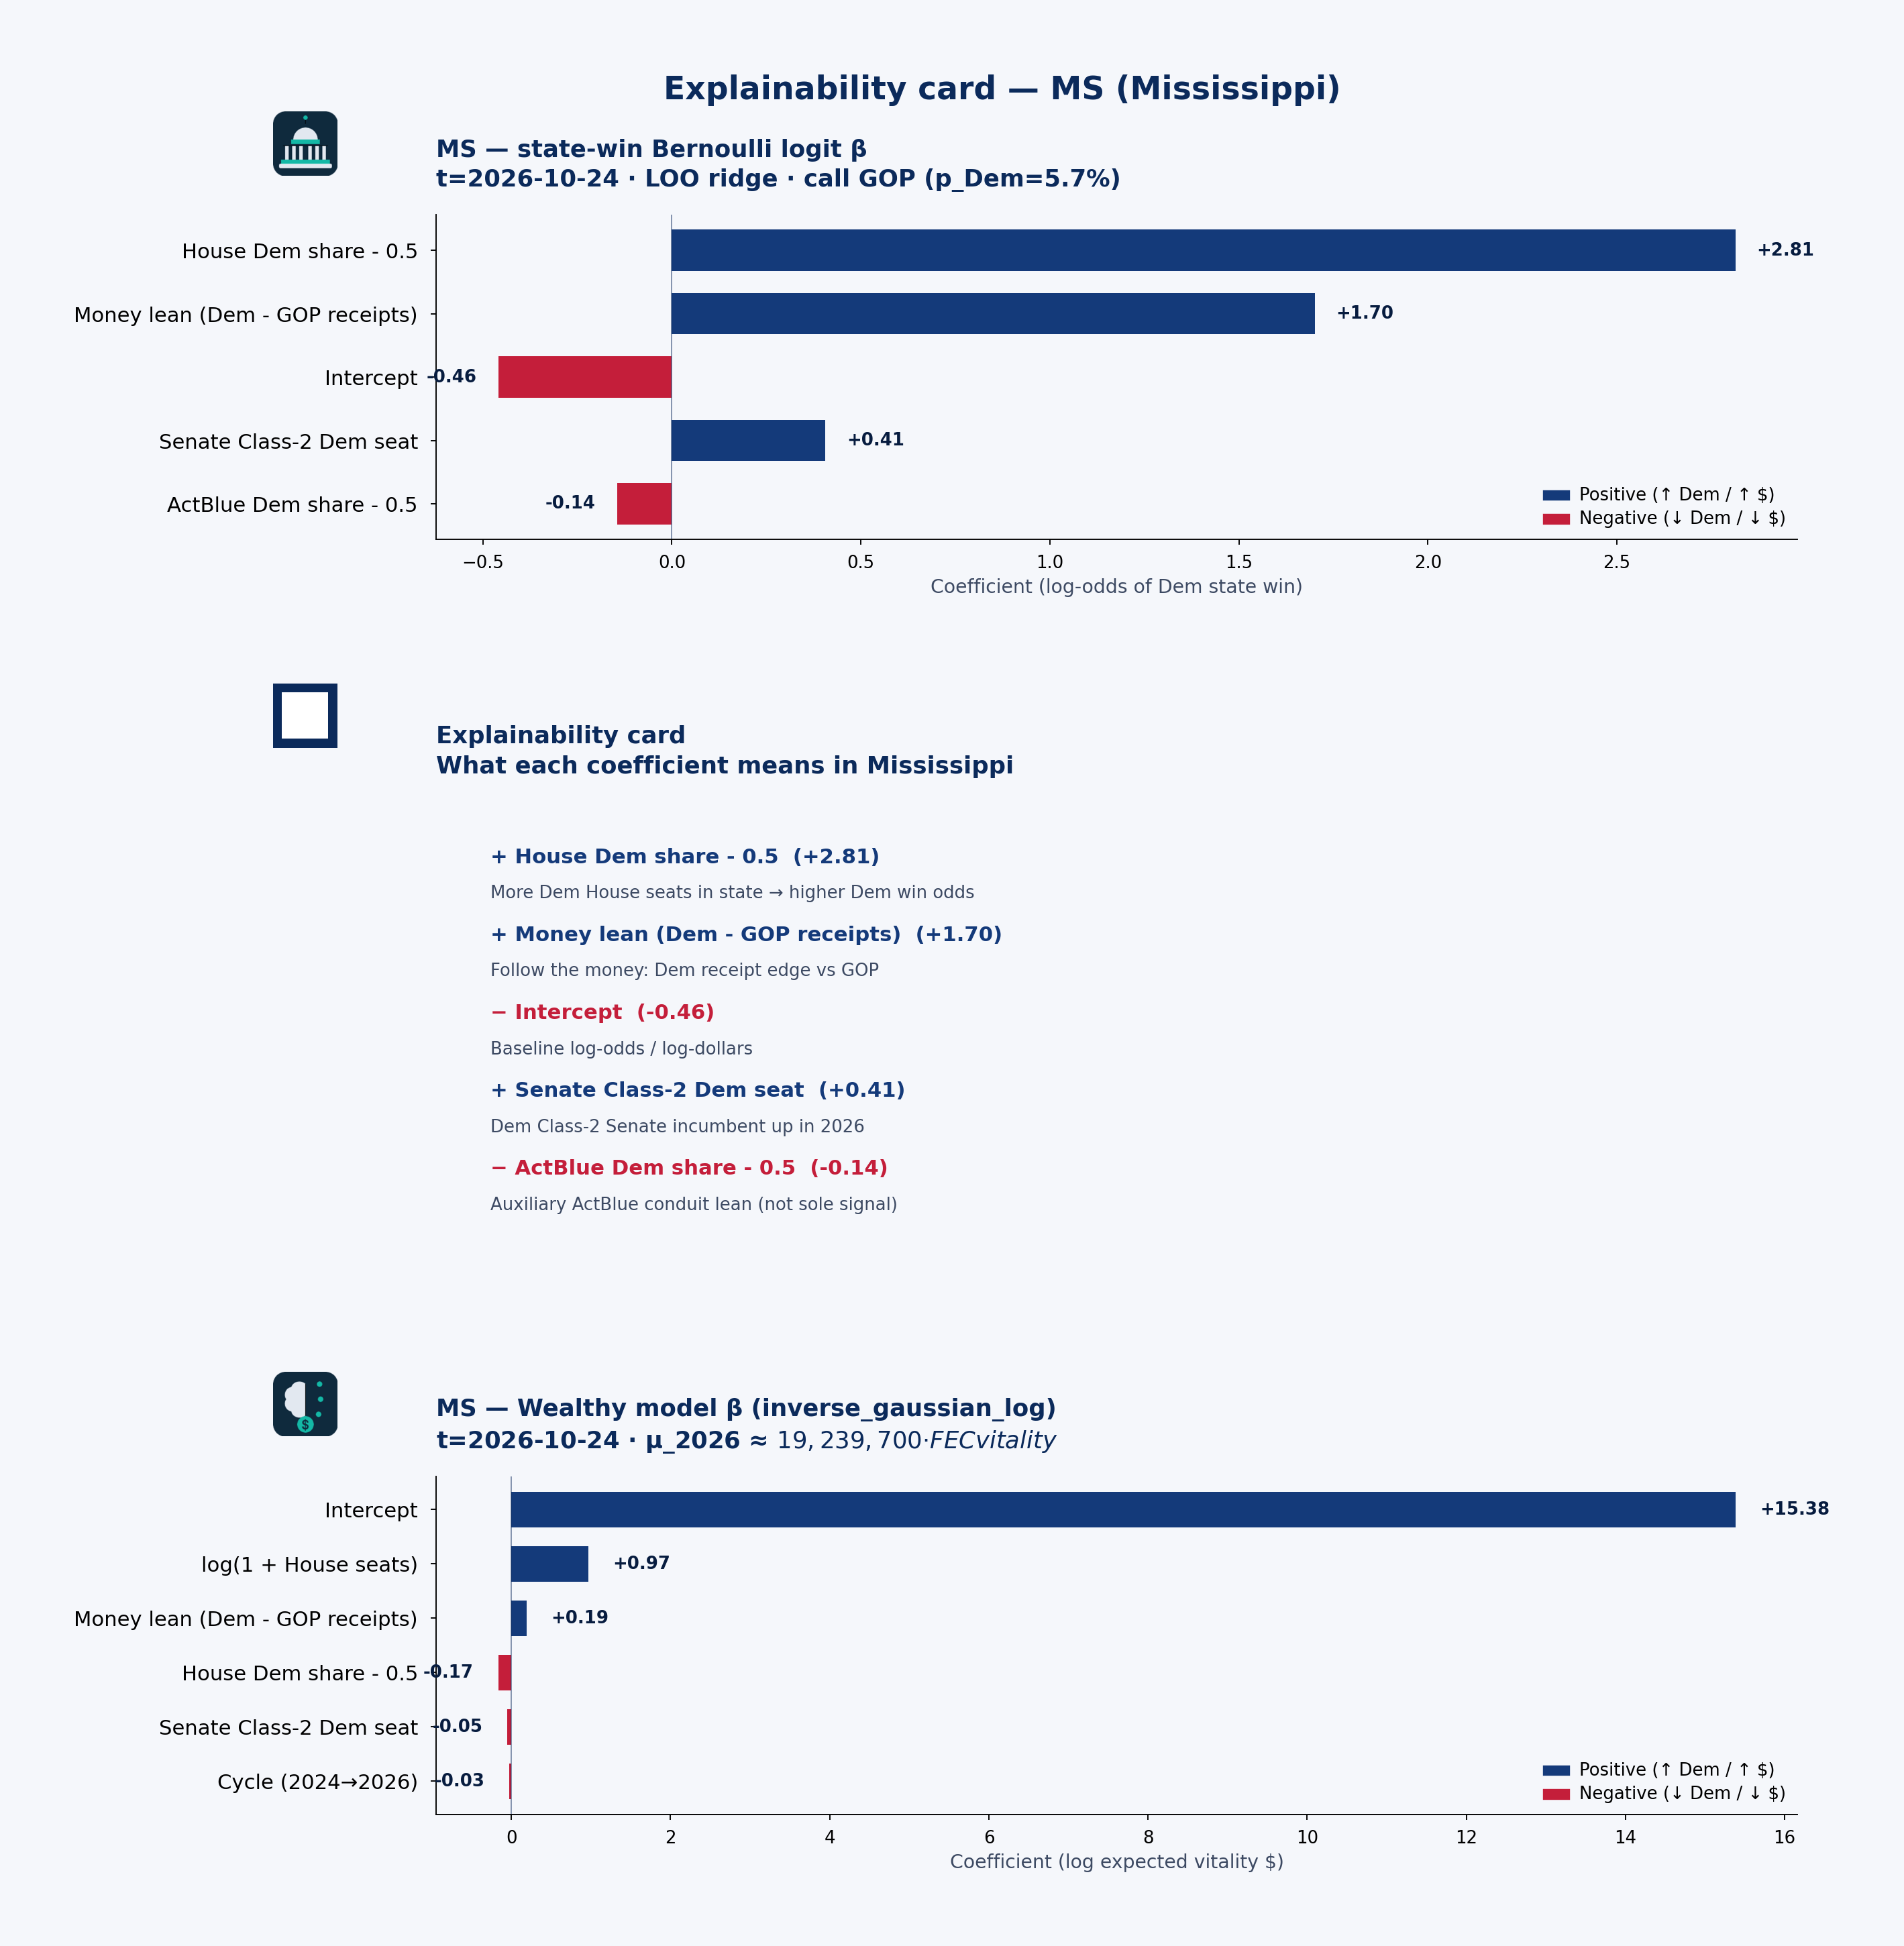 State explainability card · state-win LOO coefficient stability, plain language, and Wealthy model · MS · t=2026-10-24
Statewide call: GOP (p_Dem=6%) · 2026 money shape: balanced
Receipts by cycle (campaign-finance weball)
| Cycle | Candidate | Total receipts | Individual | PAC (other pol. cmte) |
|---|---|---|---|---|
| 2024 | EZELL, WALTER MICHAEL | $1.23M | $645k | $562k |
| 2026 | EZELL, WALTER MICHAEL | $1.15M | $539k | $562k |
| 2024 | GUEST, MICHAEL PATRICK | $926k | $416k | $509k |
| 2026 | GUEST, MICHAEL PATRICK | $1.09M | $606k | $482k |
| 2024 | HYDE-SMITH, CINDY | $751k | $498k | $250k |
| 2026 | HYDE-SMITH, CINDY | $4.65M | $2.41M | $1.28M |
| 2024 | KELLY, JOHN TRENT | $1.28M | $585k | $655k |
| 2026 | KELLY, JOHN TRENT | $1.31M | $631k | $675k |
| 2024 | THOMPSON, BENNIE G. | $1.25M | $435k | $809k |
| 2026 | THOMPSON, BENNIE G. | $928k | $225k | $696k |
| 2024 | WICKER, ROGER SEN. | $7.42M | $3.90M | $2.28M |
| 2026 | WICKER, ROGER SEN. | $307k | $129k | $138k |
PAC & individual money
PAC money was about $5.07M of $12.85M total receipts in 2024 and $3.84M of $9.44M in 2026. Direct committee→candidate 24K (non-memo) ran about $5.29M (2024) / $3.78M (2026). Itemized individual share from Mississippi: 50.4% (2024) / 48.2% (2026).
WICKER, ROGER SEN.: Cycle-to-date weball receipts ~$307k, with PAC direct 24K $2.48M → $140k vs 2024. the public campaign-finance data feed by-size individual totals are not loaded in this 50-state snapshot.
Spotlight candidates
WICKER, ROGER SEN.
- In 2024, $3.90M of $7.42M came from individuals; PAC (other pol. cmte) $2.28M.
- In 2026, $129k of $307k came from individuals; PAC (other pol. cmte) $138k.
HYDE-SMITH, CINDY
- In 2024, $498k of $751k came from individuals; PAC (other pol. cmte) $250k.
- In 2026, $2.41M of $4.65M came from individuals; PAC (other pol. cmte) $1.28M.
KELLY, JOHN TRENT
- In 2024, $585k of $1.28M came from individuals; PAC (other pol. cmte) $655k.
- In 2026, $631k of $1.31M came from individuals; PAC (other pol. cmte) $675k.
Short talking points — money & predicted voting
Open with the model set’s statewide call: GOP favored at about 6% Dem win probability on public campaign-finance + roster features — not a poll. Then the money shape: Mississippi federal candidates look balanced in 2026 weball (about $3.84M PAC / $4.54M individual of $9.44M total). Spotlight WICKER, ROGER SEN. for one concrete receipt picture. Close civic: these are public contribution patterns and a transparent forecast model call — not evidence of wrongdoing, and not a substitute for Cook or election-night counts.
MT — Montana
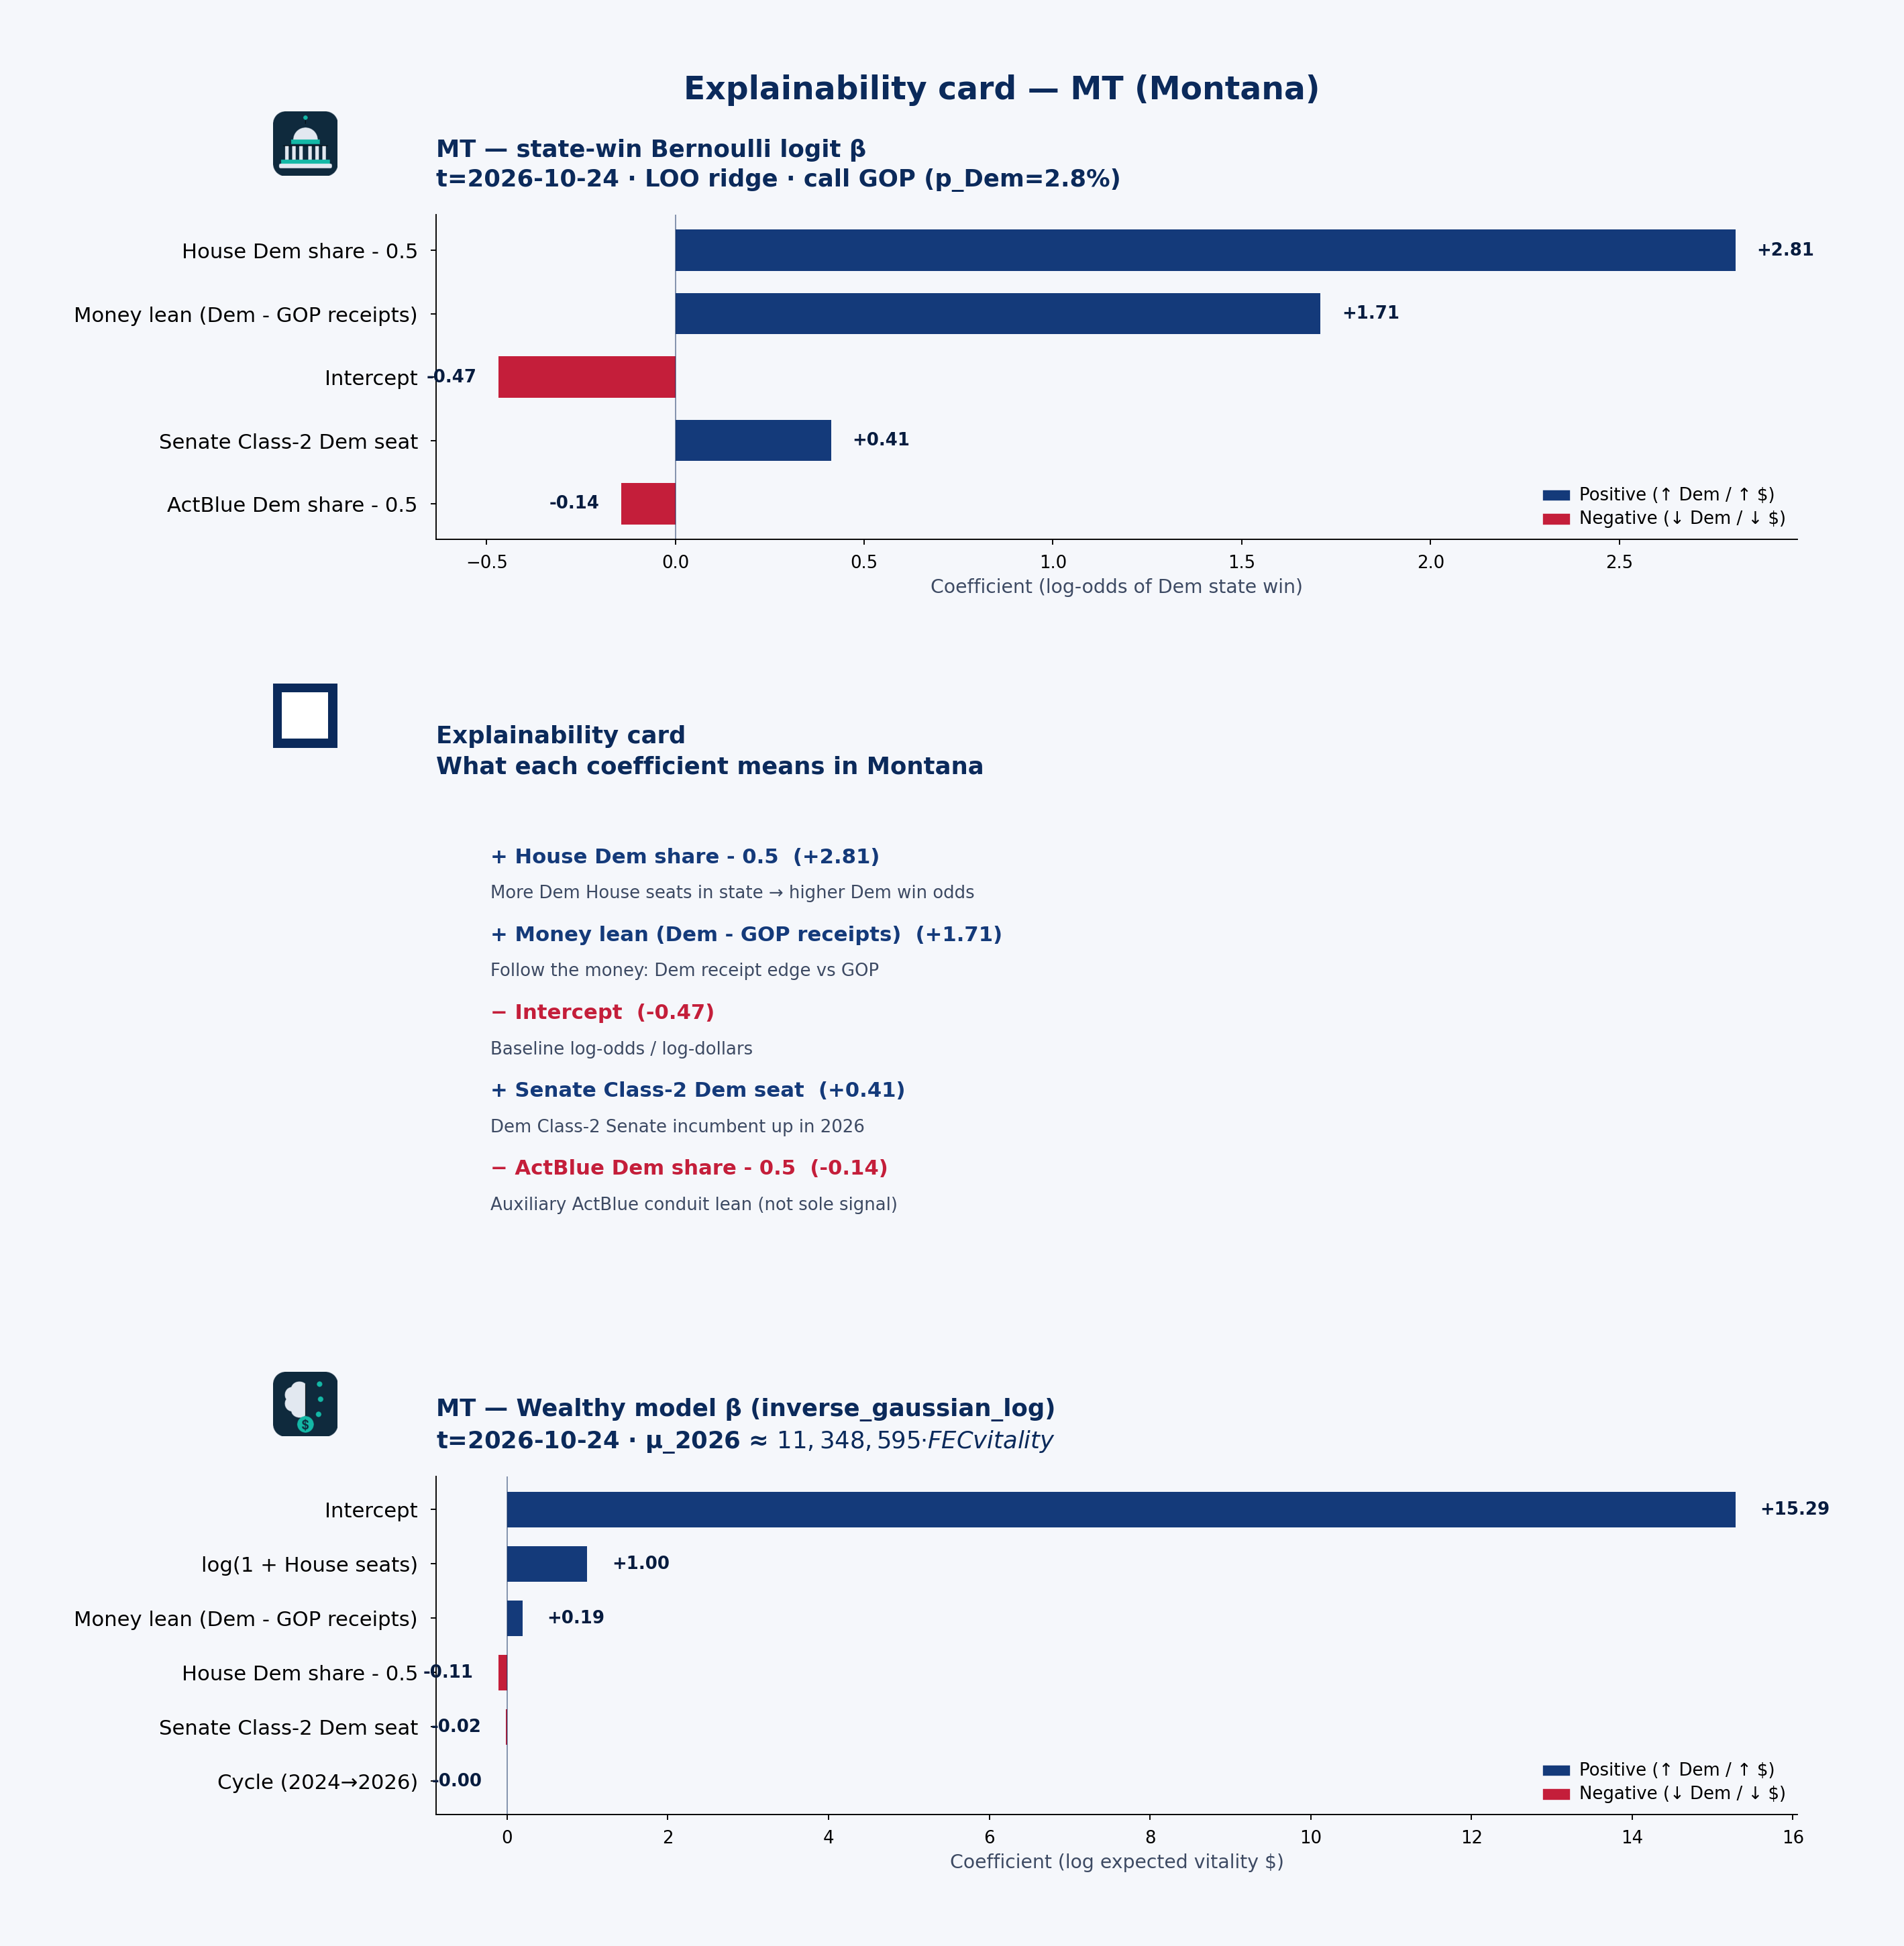 State explainability card · state-win LOO coefficient stability, plain language, and Wealthy model · MT · t=2026-10-24
Statewide call: GOP (p_Dem=3%) · 2026 money shape: balanced
Receipts by cycle (campaign-finance weball)
| Cycle | Candidate | Total receipts | Individual | PAC (other pol. cmte) |
|---|---|---|---|---|
| 2024 | DAINES, STEVE | $1.68M | $589k | $694k |
| 2026 | DAINES, STEVE | $4.78M | $1.38M | $1.35M |
| 2024 | DOWNING, TROY | $2.94M | $1.42M | $351k |
| 2026 | DOWNING, TROY | $2.73M | $1.55M | $905k |
| 2024 | SHEEHY, TIM | $30.02M | $21.78M | $1.32M |
| 2026 | SHEEHY, TIM | $1.92M | $1.20M | $502k |
| 2024 | ZINKE, RYAN K | $10.12M | $7.95M | $1.29M |
PAC & individual money
PAC money was about $3.65M of $44.76M total receipts in 2024 and $2.76M of $9.43M in 2026. Direct committee→candidate 24K (non-memo) ran about $3.64M (2024) / $2.64M (2026). Itemized individual share from Montana: 70.9% (2024) / 43.7% (2026).
SHEEHY, TIM: Cycle-to-date weball receipts ~$1.92M, with PAC direct 24K $1.44M → $418k vs 2024. the public campaign-finance data feed by-size individual totals are not loaded in this 50-state snapshot.
Spotlight candidates
SHEEHY, TIM
- In 2024, $21.78M of $30.02M came from individuals; PAC (other pol. cmte) $1.32M.
- In 2026, $1.20M of $1.92M came from individuals; PAC (other pol. cmte) $502k.
ZINKE, RYAN K
- In 2024, $7.95M of $10.12M came from individuals; PAC (other pol. cmte) $1.29M.
DAINES, STEVE
- In 2024, $589k of $1.68M came from individuals; PAC (other pol. cmte) $694k.
- In 2026, $1.38M of $4.78M came from individuals; PAC (other pol. cmte) $1.35M.
Short talking points — money & predicted voting
Open with the model set’s statewide call: GOP favored at about 3% Dem win probability on public campaign-finance + roster features — not a poll. Then the money shape: Montana federal candidates look balanced in 2026 weball (about $2.76M PAC / $4.13M individual of $9.43M total). Spotlight SHEEHY, TIM for one concrete receipt picture. Close civic: these are public contribution patterns and a transparent forecast model call — not evidence of wrongdoing, and not a substitute for Cook or election-night counts.
NC — North Carolina
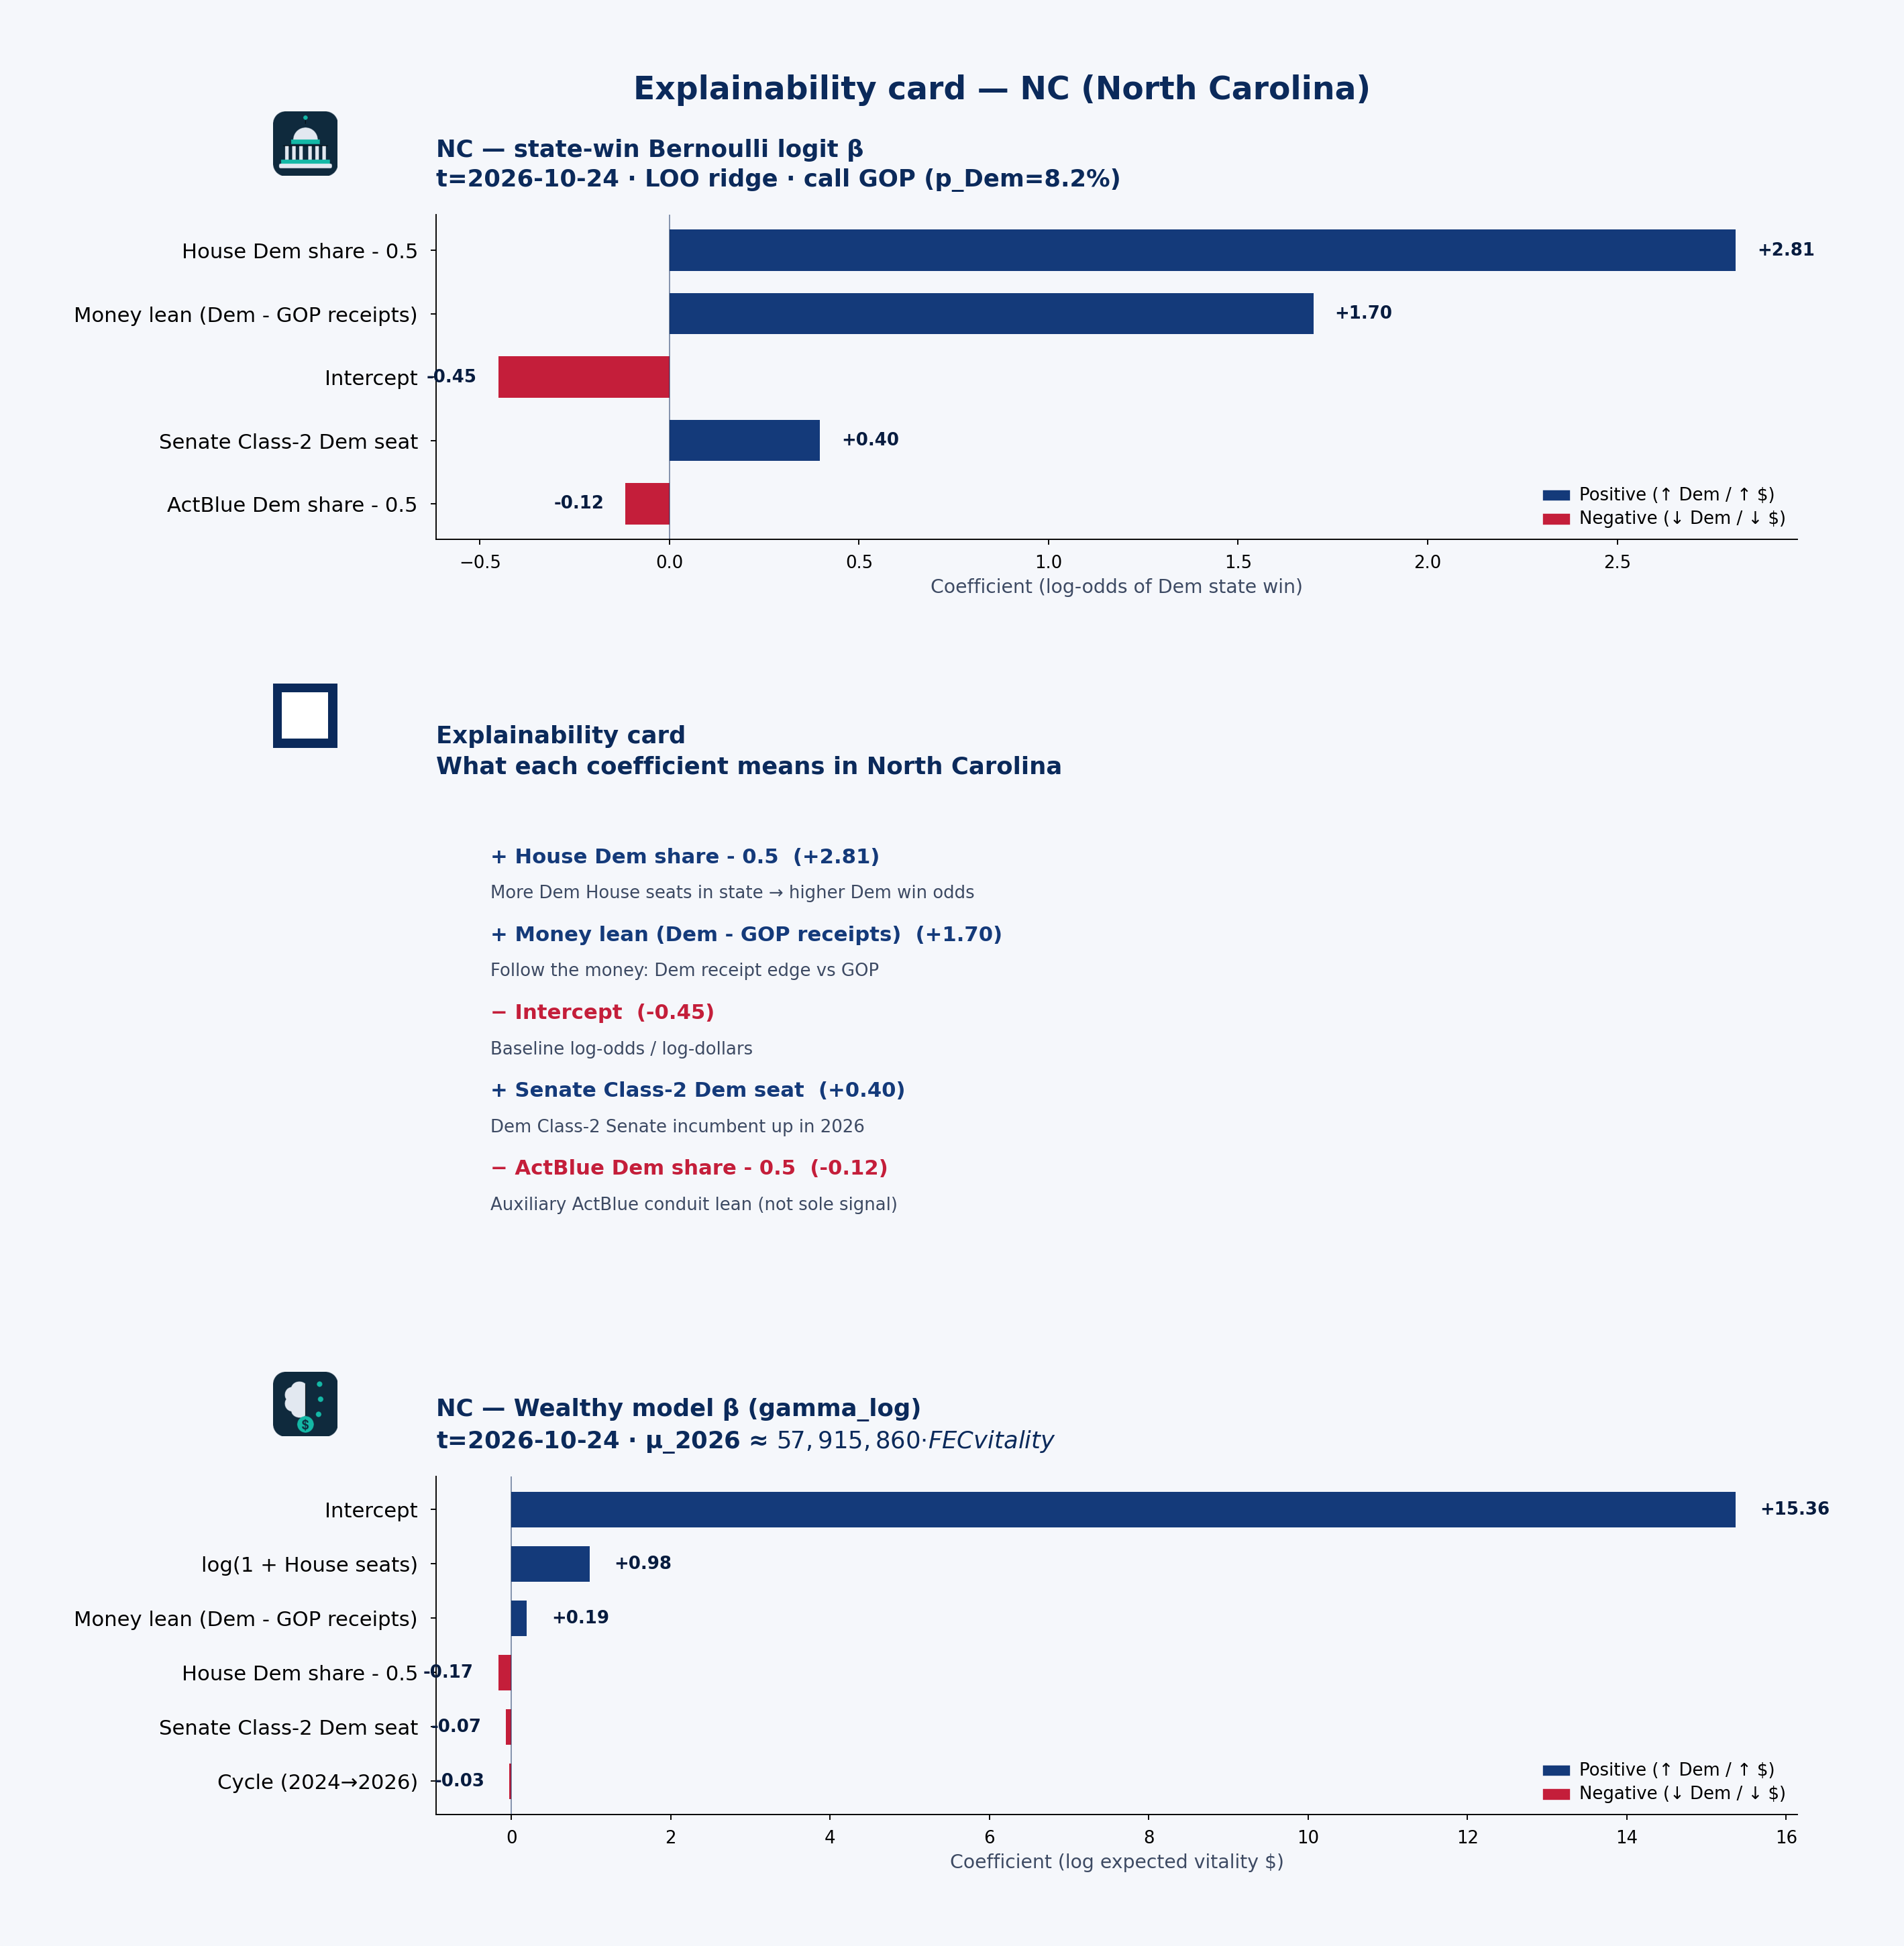 State explainability card · state-win LOO coefficient stability, plain language, and Wealthy model · NC · t=2026-10-24
Statewide call: GOP (p_Dem=8%) · 2026 money shape: individual-heavy
Receipts by cycle (campaign-finance weball)
| Cycle | Candidate | Total receipts | Individual | PAC (other pol. cmte) |
|---|---|---|---|---|
| 2026 | AGER, JAMIE | $5.87M | $5.04M | $371k |
| 2024 | BUCKHOUT, LAURIE | $4.80M | $1.93M | $515k |
| 2026 | BUCKHOUT, LAURIE | $4.79M | $1.08M | $534k |
| 2026 | COOPER, ROY | $49.59M | $17.99M | $932k |
| 2024 | DAUGHTRY, KELLY | $4.51M | $143k | $6k |
| 2024 | DAVIS, DON | $6.06M | $3.77M | $1.84M |
| 2026 | DAVIS, DON | $5.81M | $3.32M | $1.89M |
| 2024 | HUDSON, RICHARD L. JR. | $3.95M | $1.27M | $2.02M |
| 2026 | HUDSON, RICHARD L. JR. | $4.17M | $1.41M | $2.00M |
| 2026 | TILLIS, THOM R SEN | $4.71M | $2.64M | $1.48M |
| 2024 | TILLIS, THOM R. SEN. | $2.47M | $1.37M | $1.05M |
| 2026 | WHATLEY, MICHAEL | $13.67M | $7.26M | $970k |
PAC & individual money
PAC money was about $16.23M of $75.03M total receipts in 2024 and $18.14M of $129.52M in 2026. Direct committee→candidate 24K (non-memo) ran about $15.14M (2024) / $15.71M (2026). Itemized individual share from North Carolina: 44.2% (2024) / 48.4% (2026).
COOPER, ROY: Cycle-to-date weball receipts ~$49.59M, with PAC direct 24K $0 → $936k vs 2024. the public campaign-finance data feed by-size individual totals are not loaded in this 50-state snapshot.
Spotlight candidates
COOPER, ROY
- In 2026, $17.99M of $49.59M came from individuals; PAC (other pol. cmte) $932k.
WHATLEY, MICHAEL
- In 2026, $7.26M of $13.67M came from individuals; PAC (other pol. cmte) $970k.
DAVIS, DON
- In 2024, $3.77M of $6.06M came from individuals; PAC (other pol. cmte) $1.84M.
- In 2026, $3.32M of $5.81M came from individuals; PAC (other pol. cmte) $1.89M.
Short talking points — money & predicted voting
Open with the model set’s statewide call: GOP favored at about 8% Dem win probability on public campaign-finance + roster features — not a poll. Then the money shape: North Carolina federal candidates look individual-heavy in 2026 weball (about $18.14M PAC / $62.74M individual of $129.52M total). Spotlight COOPER, ROY for one concrete receipt picture. Close civic: these are public contribution patterns and a transparent forecast model call — not evidence of wrongdoing, and not a substitute for Cook or election-night counts.
ND — North Dakota
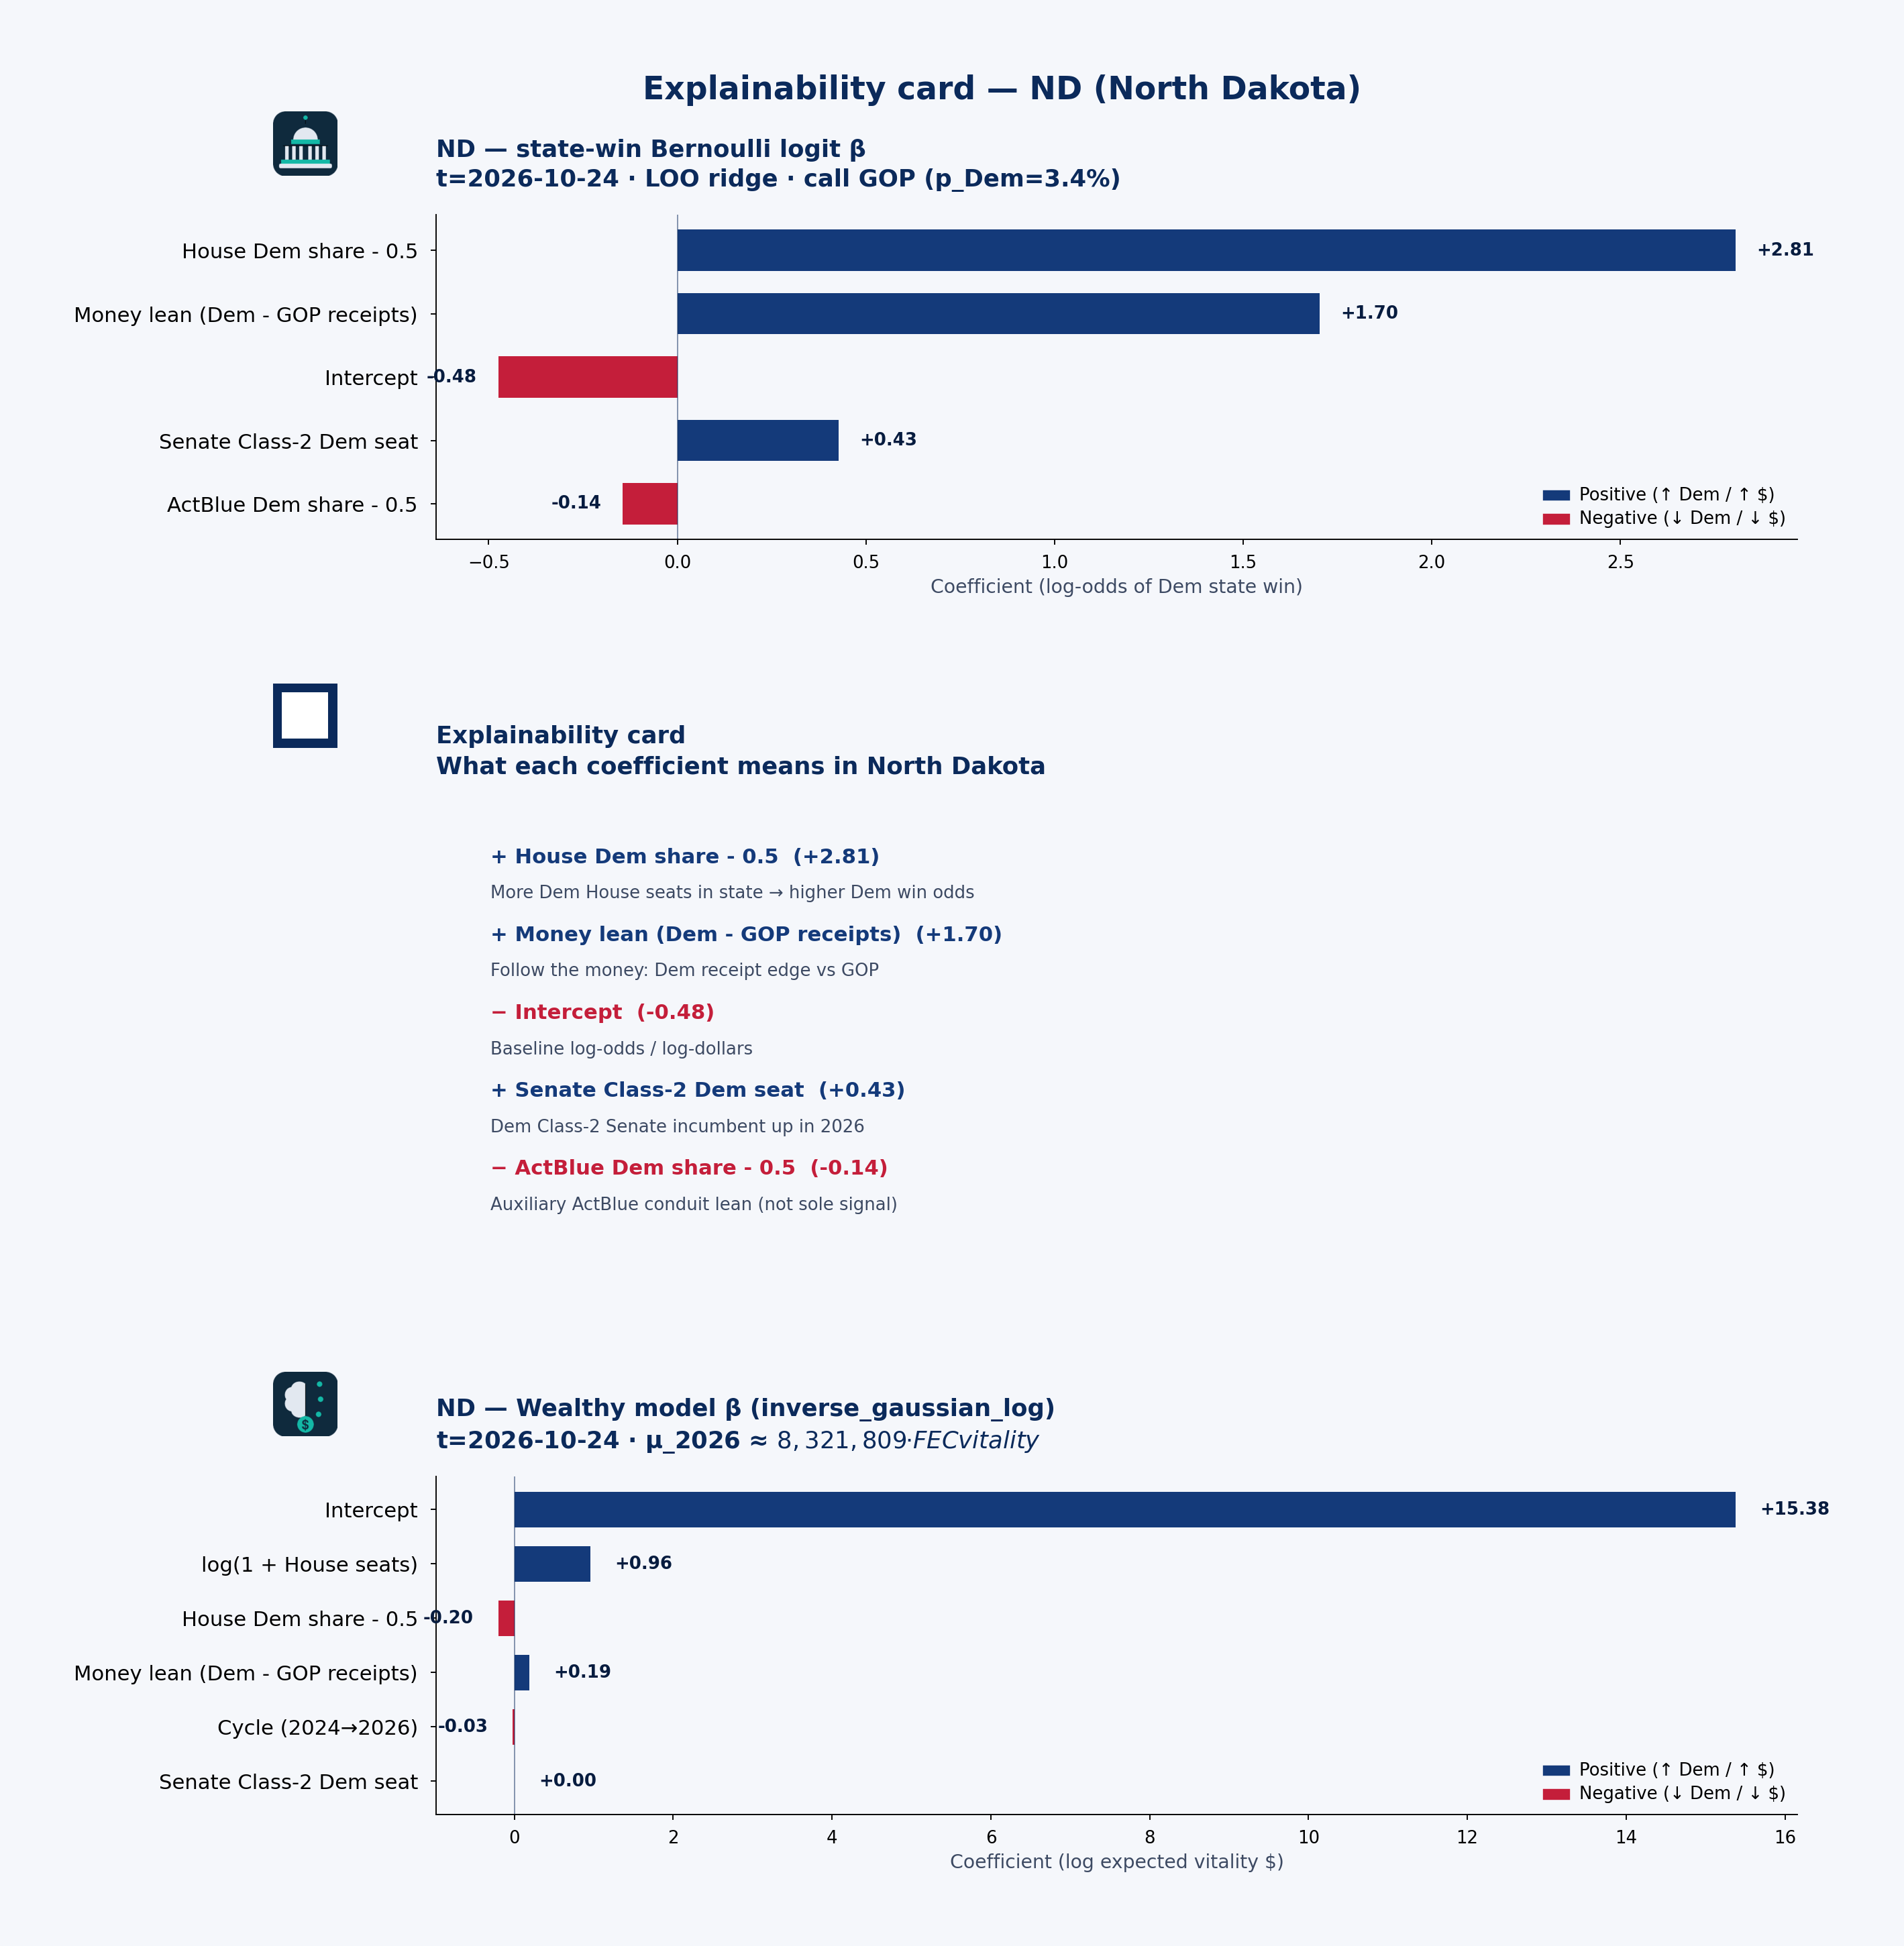 State explainability card · state-win LOO coefficient stability, plain language, and Wealthy model · ND · t=2026-10-24
Statewide call: GOP (p_Dem=3%) · 2026 money shape: balanced
Receipts by cycle (campaign-finance weball)
| Cycle | Candidate | Total receipts | Individual | PAC (other pol. cmte) |
|---|---|---|---|---|
| 2024 | CRAMER, KEVIN MR. | $5.56M | $2.65M | $1.78M |
| 2026 | CRAMER, KEVIN MR. | $1.33M | $1.01M | $234k |
| 2024 | FEDORCHAK, JULIE | $1.98M | $1.33M | $556k |
| 2026 | FEDORCHAK, JULIE | $2.11M | $506k | $1.17M |
| 2024 | HOEVEN, JOHN | $531k | $218k | $214k |
| 2026 | HOEVEN, JOHN | $523k | $241k | $207k |
PAC & individual money
PAC money was about $2.55M of $8.07M total receipts in 2024 and $1.61M of $3.96M in 2026. Direct committee→candidate 24K (non-memo) ran about $2.56M (2024) / $1.59M (2026). Itemized individual share from North Dakota: 52.0% (2024) / 44.5% (2026).
CRAMER, KEVIN MR.: Cycle-to-date weball receipts ~$1.33M, with PAC direct 24K $1.74M → $216k vs 2024. the public campaign-finance data feed by-size individual totals are not loaded in this 50-state snapshot.
Spotlight candidates
CRAMER, KEVIN MR.
- In 2024, $2.65M of $5.56M came from individuals; PAC (other pol. cmte) $1.78M.
- In 2026, $1.01M of $1.33M came from individuals; PAC (other pol. cmte) $234k.
FEDORCHAK, JULIE
- In 2024, $1.33M of $1.98M came from individuals; PAC (other pol. cmte) $556k.
- In 2026, $506k of $2.11M came from individuals; PAC (other pol. cmte) $1.17M.
HOEVEN, JOHN
- In 2024, $218k of $531k came from individuals; PAC (other pol. cmte) $214k.
- In 2026, $241k of $523k came from individuals; PAC (other pol. cmte) $207k.
Short talking points — money & predicted voting
Open with the model set’s statewide call: GOP favored at about 3% Dem win probability on public campaign-finance + roster features — not a poll. Then the money shape: North Dakota federal candidates look balanced in 2026 weball (about $1.61M PAC / $1.76M individual of $3.96M total). Spotlight CRAMER, KEVIN MR. for one concrete receipt picture. Close civic: these are public contribution patterns and a transparent forecast model call — not evidence of wrongdoing, and not a substitute for Cook or election-night counts.
NE — Nebraska
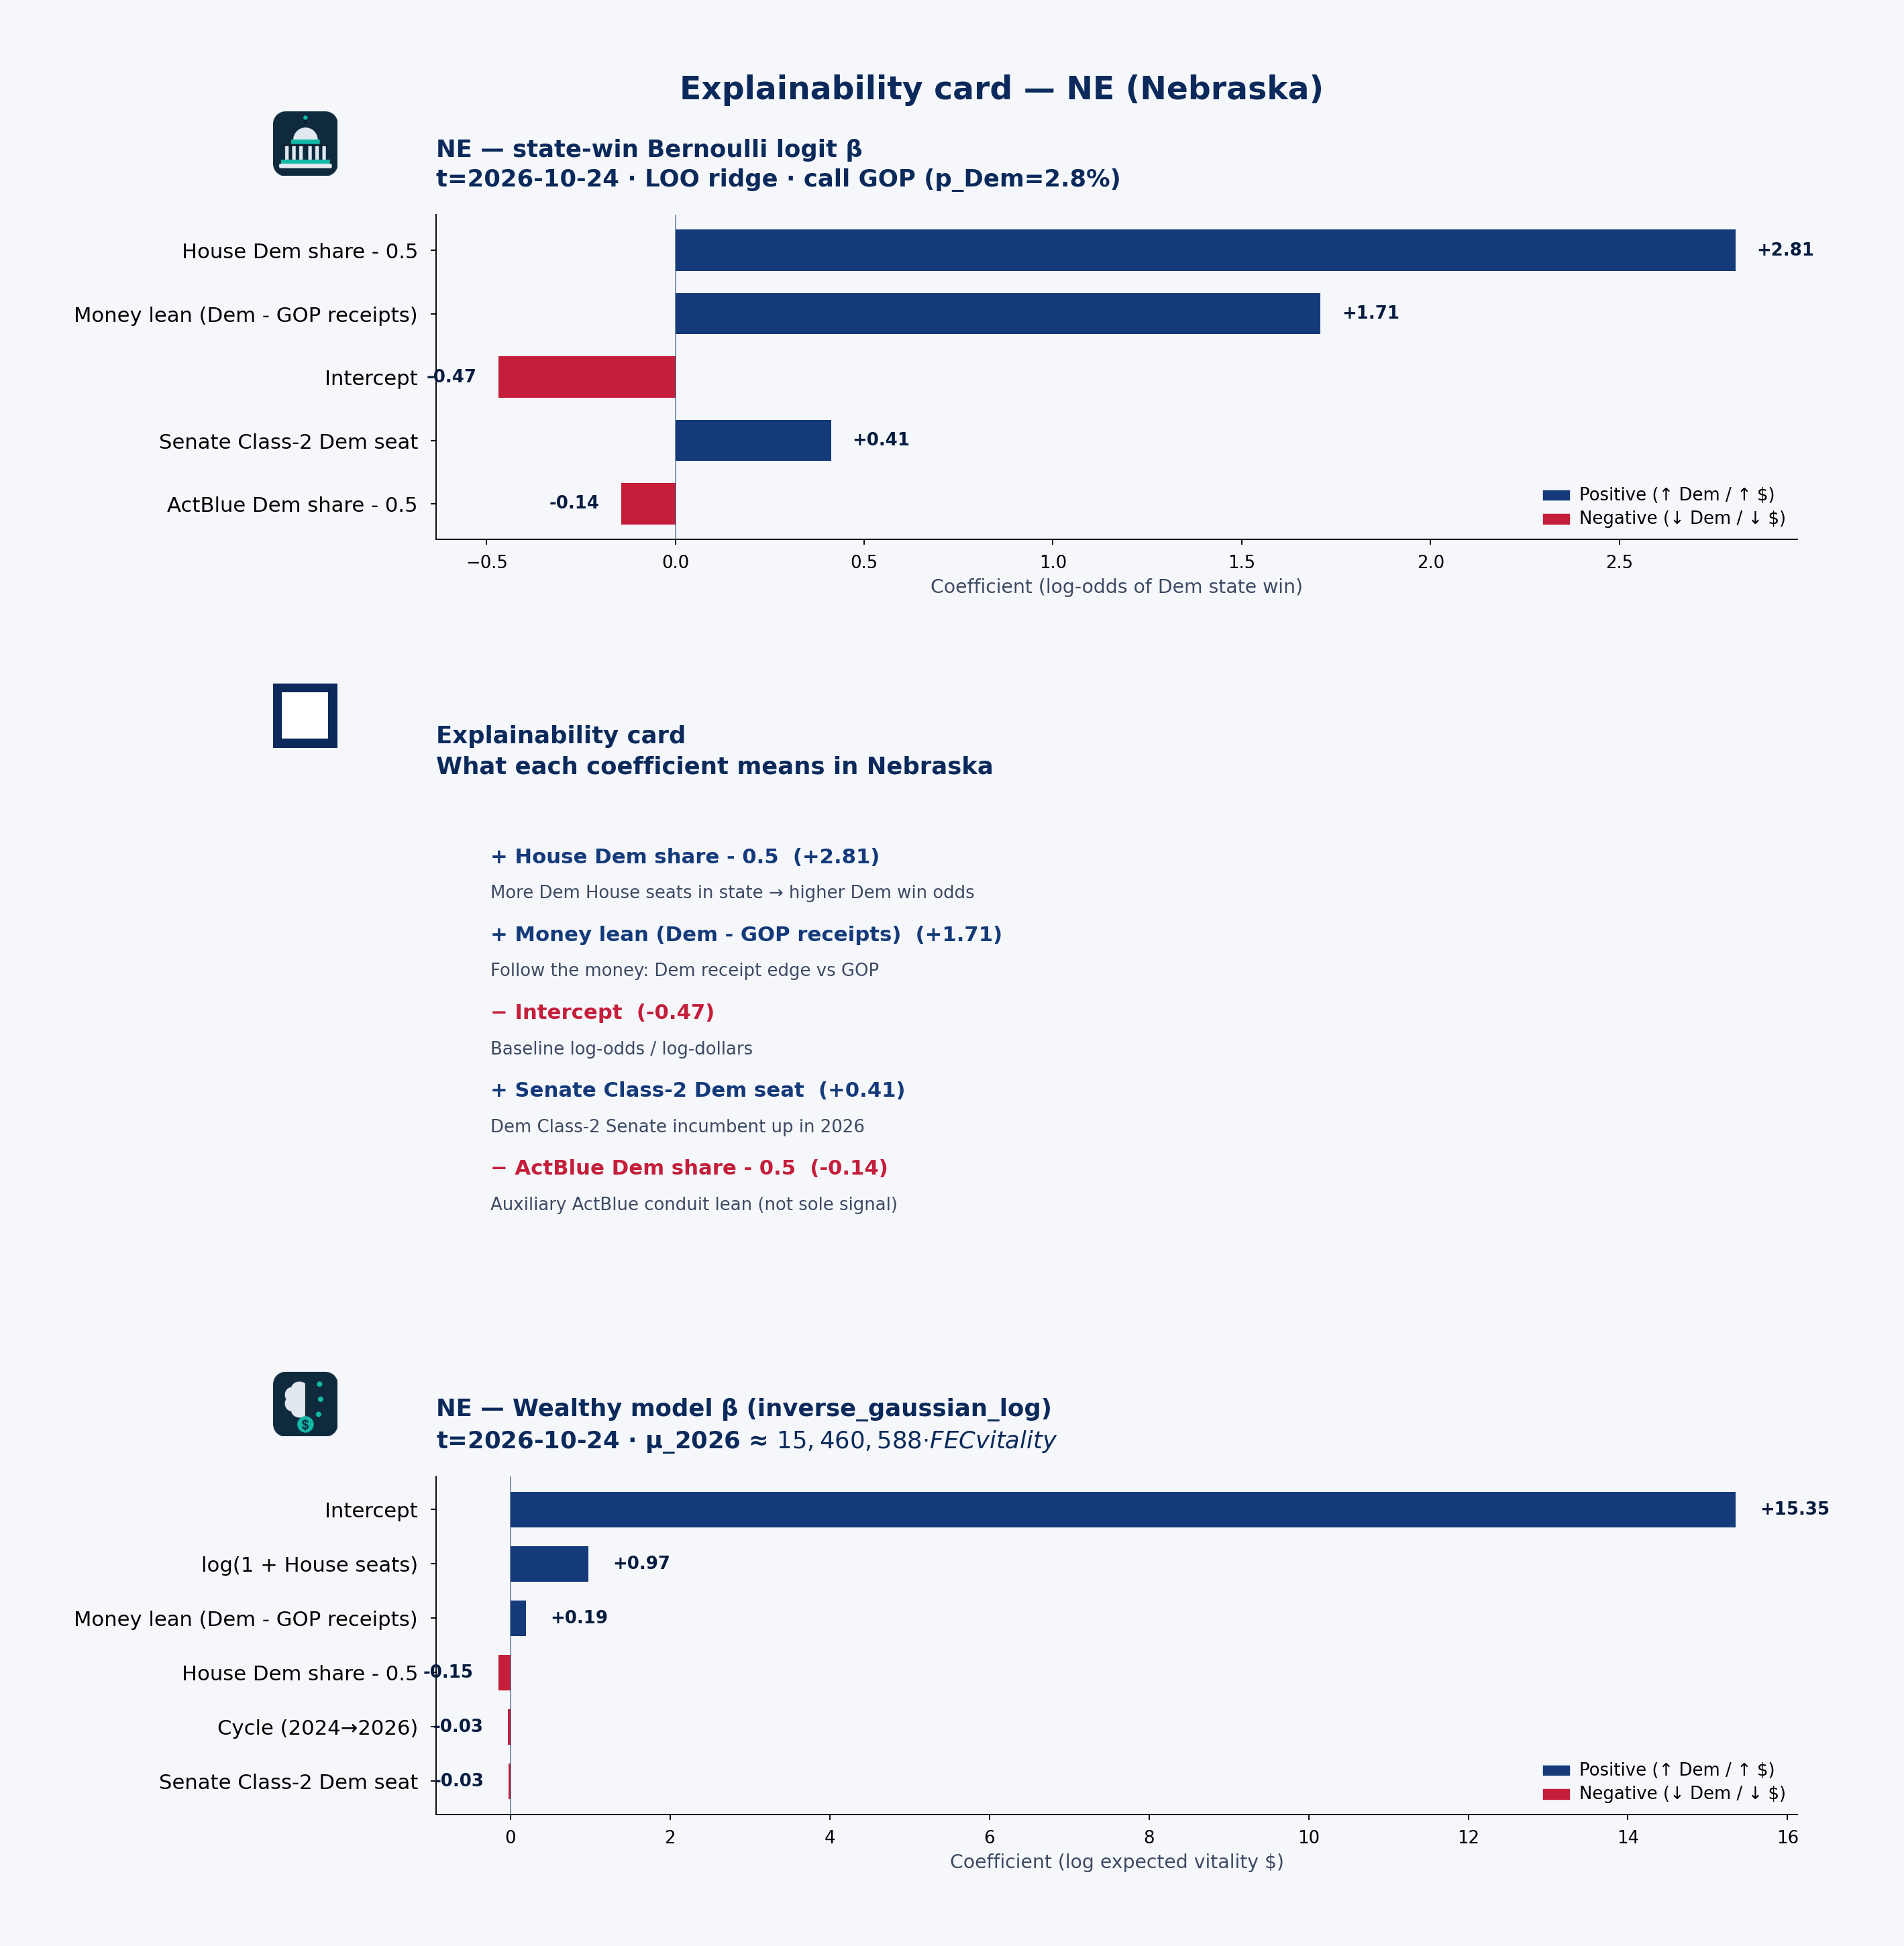 State explainability card · state-win LOO coefficient stability, plain language, and Wealthy model · NE · t=2026-10-24
Statewide call: GOP (p_Dem=3%) · 2026 money shape: balanced
Receipts by cycle (campaign-finance weball)
| Cycle | Candidate | Total receipts | Individual | PAC (other pol. cmte) |
|---|---|---|---|---|
| 2024 | BACON, DONALD J | $6.36M | $3.24M | $2.19M |
| 2026 | BACON, DONALD J | $1.50M | $405k | $528k |
| 2024 | FISCHER, DEBRA S. | $6.56M | $2.68M | $2.30M |
| 2026 | FISCHER, DEBRA S. | $976k | $369k | $399k |
| 2024 | FLOOD, MIKE | $2.01M | $1.03M | $909k |
| 2026 | FLOOD, MIKE | $2.77M | $1.17M | $1.39M |
| 2024 | RICKETTS, PETE | $5.88M | $1.70M | $1.38M |
| 2026 | RICKETTS, PETE | $14.55M | $2.86M | $1.91M |
| 2024 | SMITH, ADRIAN | $2.00M | $456k | $1.46M |
| 2026 | SMITH, ADRIAN | $2.25M | $442k | $1.62M |
PAC & individual money
PAC money was about $8.24M of $22.79M total receipts in 2024 and $5.85M of $22.04M in 2026. Direct committee→candidate 24K (non-memo) ran about $8.04M (2024) / $5.13M (2026). Itemized individual share from Nebraska: 39.9% (2024) / 23.8% (2026).
RICKETTS, PETE: Cycle-to-date weball receipts ~$14.55M, with PAC direct 24K $853k → $1.49M vs 2024. the public campaign-finance data feed by-size individual totals are not loaded in this 50-state snapshot.
Spotlight candidates
RICKETTS, PETE
- In 2024, $1.70M of $5.88M came from individuals; PAC (other pol. cmte) $1.38M.
- In 2026, $2.86M of $14.55M came from individuals; PAC (other pol. cmte) $1.91M.
FISCHER, DEBRA S.
- In 2024, $2.68M of $6.56M came from individuals; PAC (other pol. cmte) $2.30M.
- In 2026, $369k of $976k came from individuals; PAC (other pol. cmte) $399k.
BACON, DONALD J
- In 2024, $3.24M of $6.36M came from individuals; PAC (other pol. cmte) $2.19M.
- In 2026, $405k of $1.50M came from individuals; PAC (other pol. cmte) $528k.
Short talking points — money & predicted voting
Open with the model set’s statewide call: GOP favored at about 3% Dem win probability on public campaign-finance + roster features — not a poll. Then the money shape: Nebraska federal candidates look balanced in 2026 weball (about $5.85M PAC / $5.25M individual of $22.04M total). Spotlight RICKETTS, PETE for one concrete receipt picture. Close civic: these are public contribution patterns and a transparent forecast model call — not evidence of wrongdoing, and not a substitute for Cook or election-night counts.
NH — New Hampshire
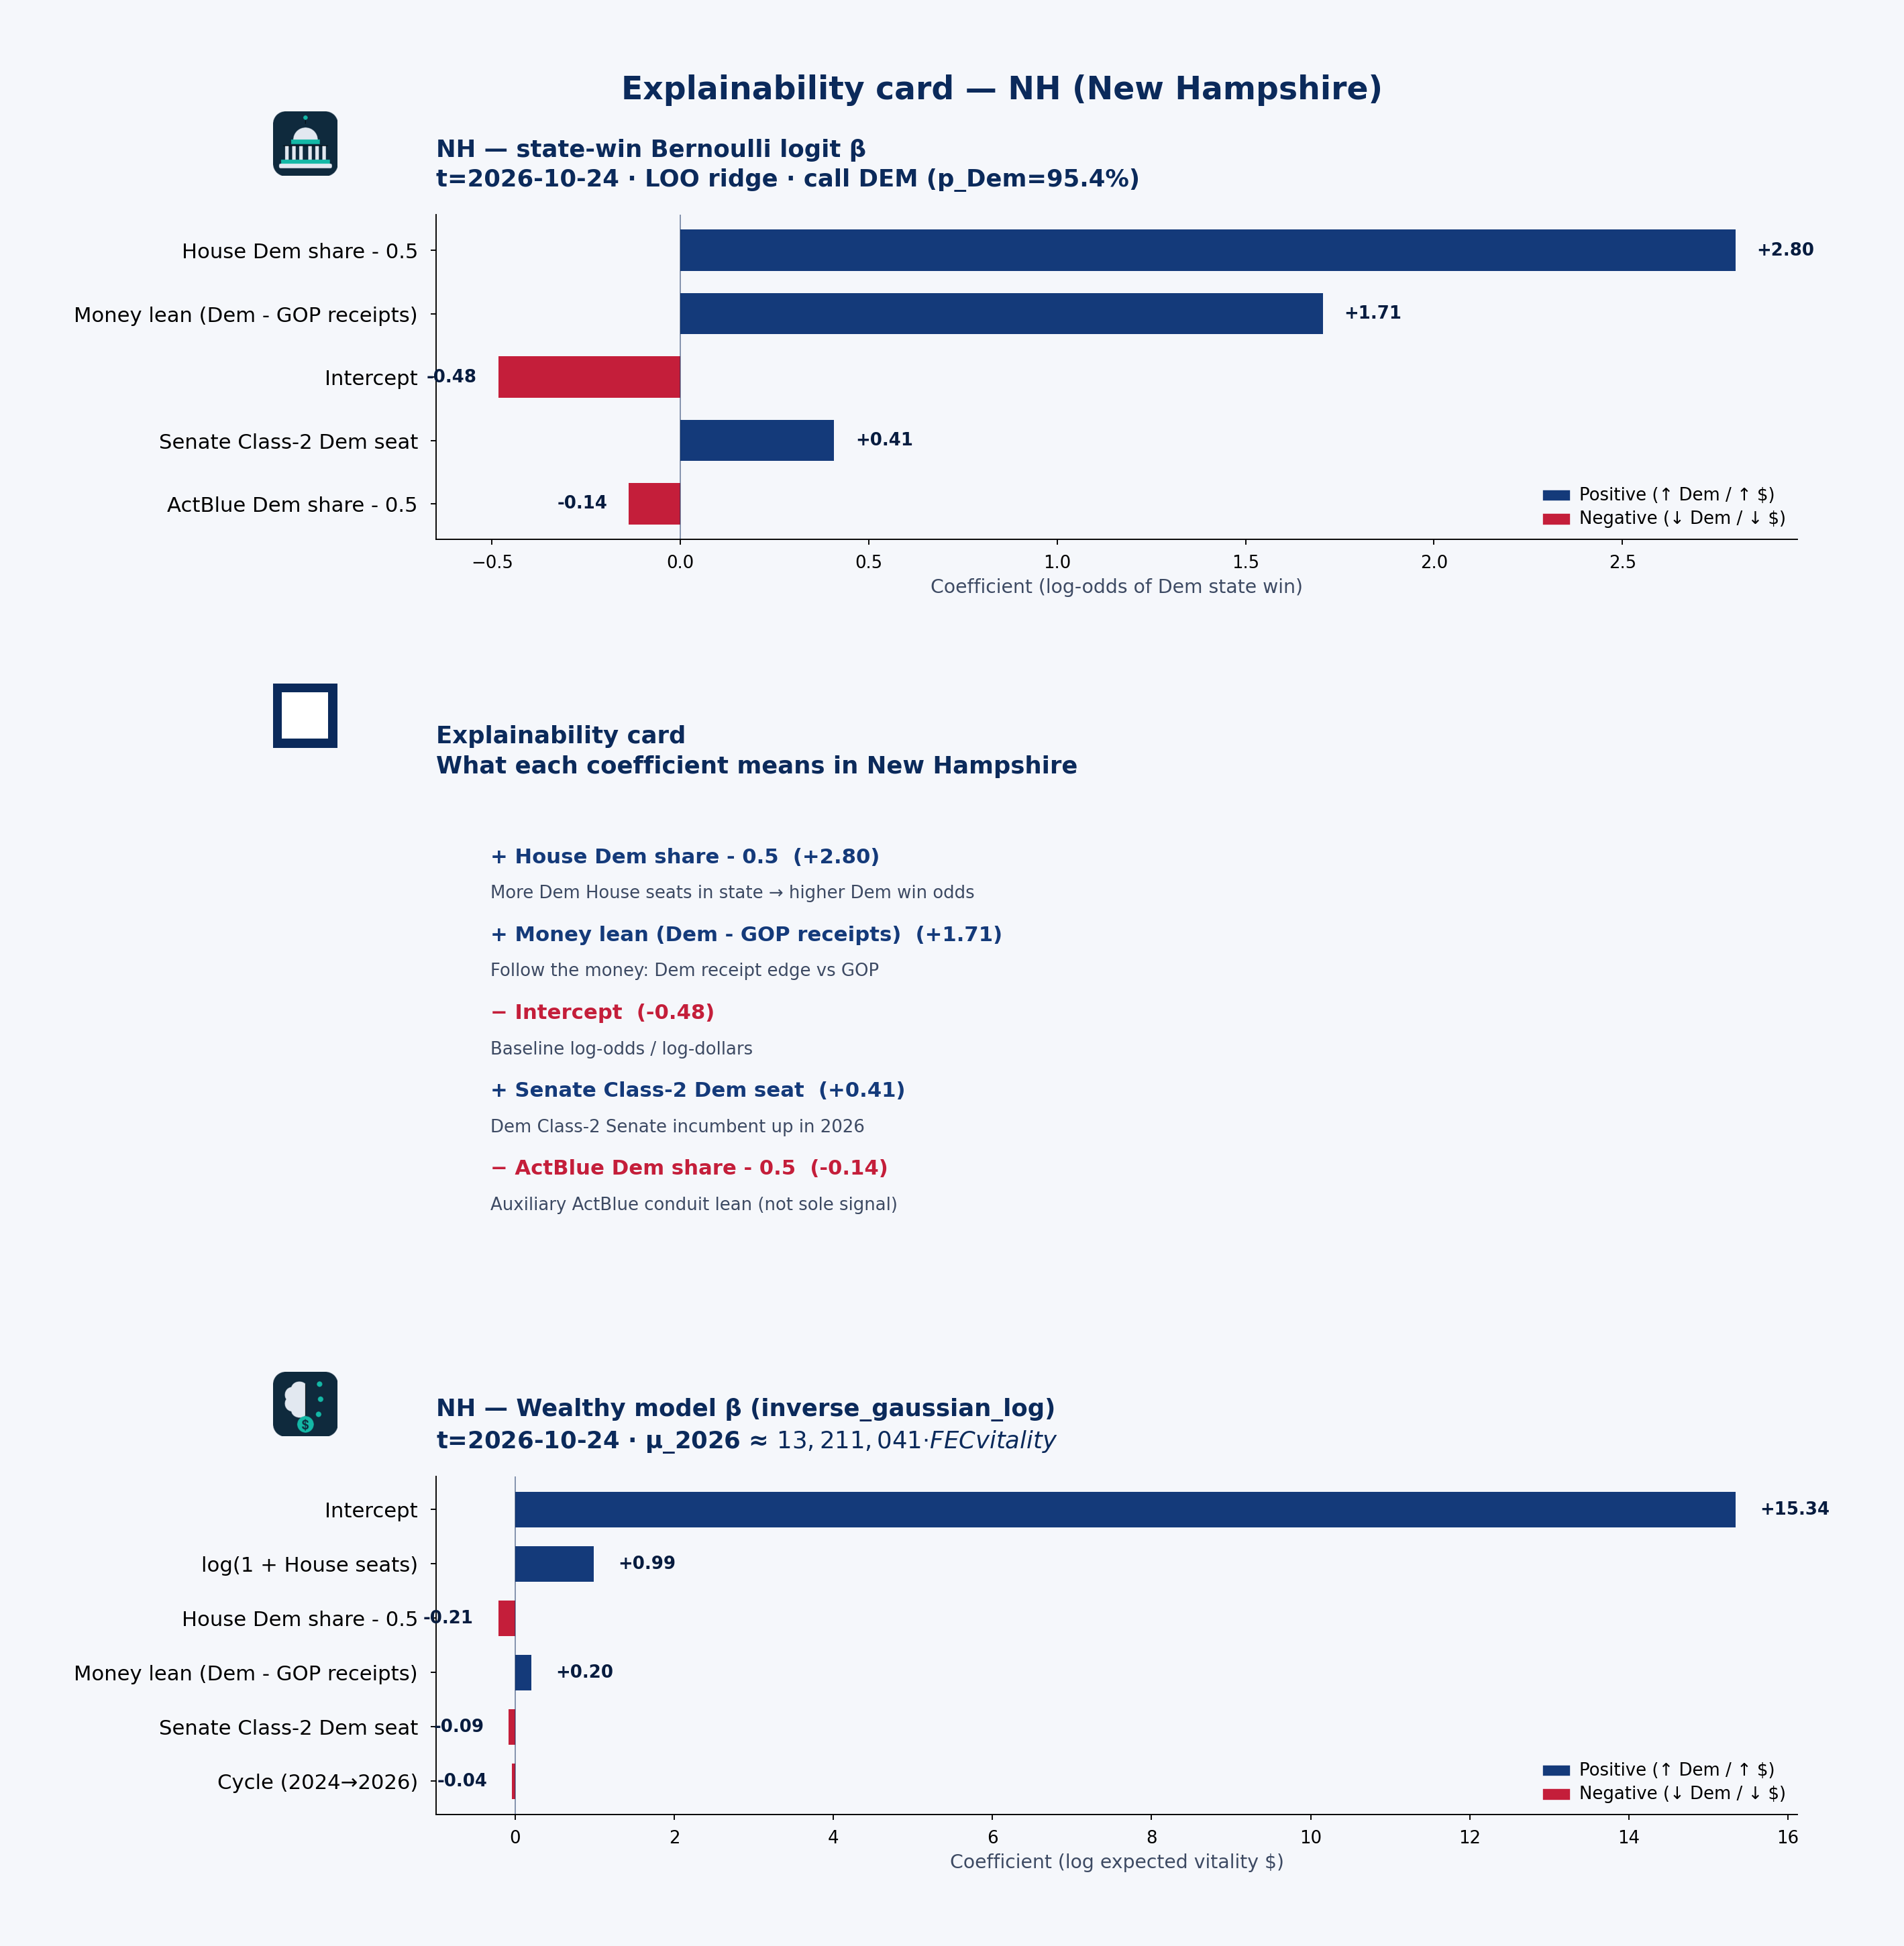 State explainability card · state-win LOO coefficient stability, plain language, and Wealthy model · NH · t=2026-10-24
Statewide call: DEM (p_Dem=95%) · 2026 money shape: individual-heavy
Receipts by cycle (campaign-finance weball)
| Cycle | Candidate | Total receipts | Individual | PAC (other pol. cmte) |
|---|---|---|---|---|
| 2024 | GOODLANDER, MAGGIE | $4.36M | $3.93M | $393k |
| 2026 | GOODLANDER, MAGGIE | $5.01M | $3.49M | $386k |
| 2024 | HASSAN, MARGARET WOOD | $2.90M | $1.99M | $588k |
| 2026 | HASSAN, MARGARET WOOD | $3.18M | $2.47M | $655k |
| 2026 | PAPPAS, CHRIS | $23.70M | $21.08M | $1.36M |
| 2024 | SHAHEEN, JEANNE | $1.19M | $859k | $303k |
| 2026 | SHAHEEN, JEANNE | $177k | $101k | $55k |
PAC & individual money
PAC money was about $1.28M of $8.45M total receipts in 2024 and $2.46M of $32.07M in 2026. Direct committee→candidate 24K (non-memo) ran about $1.32M (2024) / $1.92M (2026). Itemized individual share from New Hampshire: 80.3% (2024) / 84.6% (2026).
PAPPAS, CHRIS: Cycle-to-date weball receipts ~$23.70M, with PAC direct 24K $0 → $868k vs 2024. the public campaign-finance data feed by-size individual totals are not loaded in this 50-state snapshot.
Spotlight candidates
PAPPAS, CHRIS
- In 2026, $21.08M of $23.70M came from individuals; PAC (other pol. cmte) $1.36M.
GOODLANDER, MAGGIE
- In 2024, $3.93M of $4.36M came from individuals; PAC (other pol. cmte) $393k.
- In 2026, $3.49M of $5.01M came from individuals; PAC (other pol. cmte) $386k.
HASSAN, MARGARET WOOD
- In 2024, $1.99M of $2.90M came from individuals; PAC (other pol. cmte) $588k.
- In 2026, $2.47M of $3.18M came from individuals; PAC (other pol. cmte) $655k.
Short talking points — money & predicted voting
Open with the model set’s statewide call: DEM favored at about 95% Dem win probability on public campaign-finance + roster features — not a poll. Then the money shape: New Hampshire federal candidates look individual-heavy in 2026 weball (about $2.46M PAC / $27.14M individual of $32.07M total). Spotlight PAPPAS, CHRIS for one concrete receipt picture. Close civic: these are public contribution patterns and a transparent forecast model call — not evidence of wrongdoing, and not a substitute for Cook or election-night counts.
NJ — New Jersey
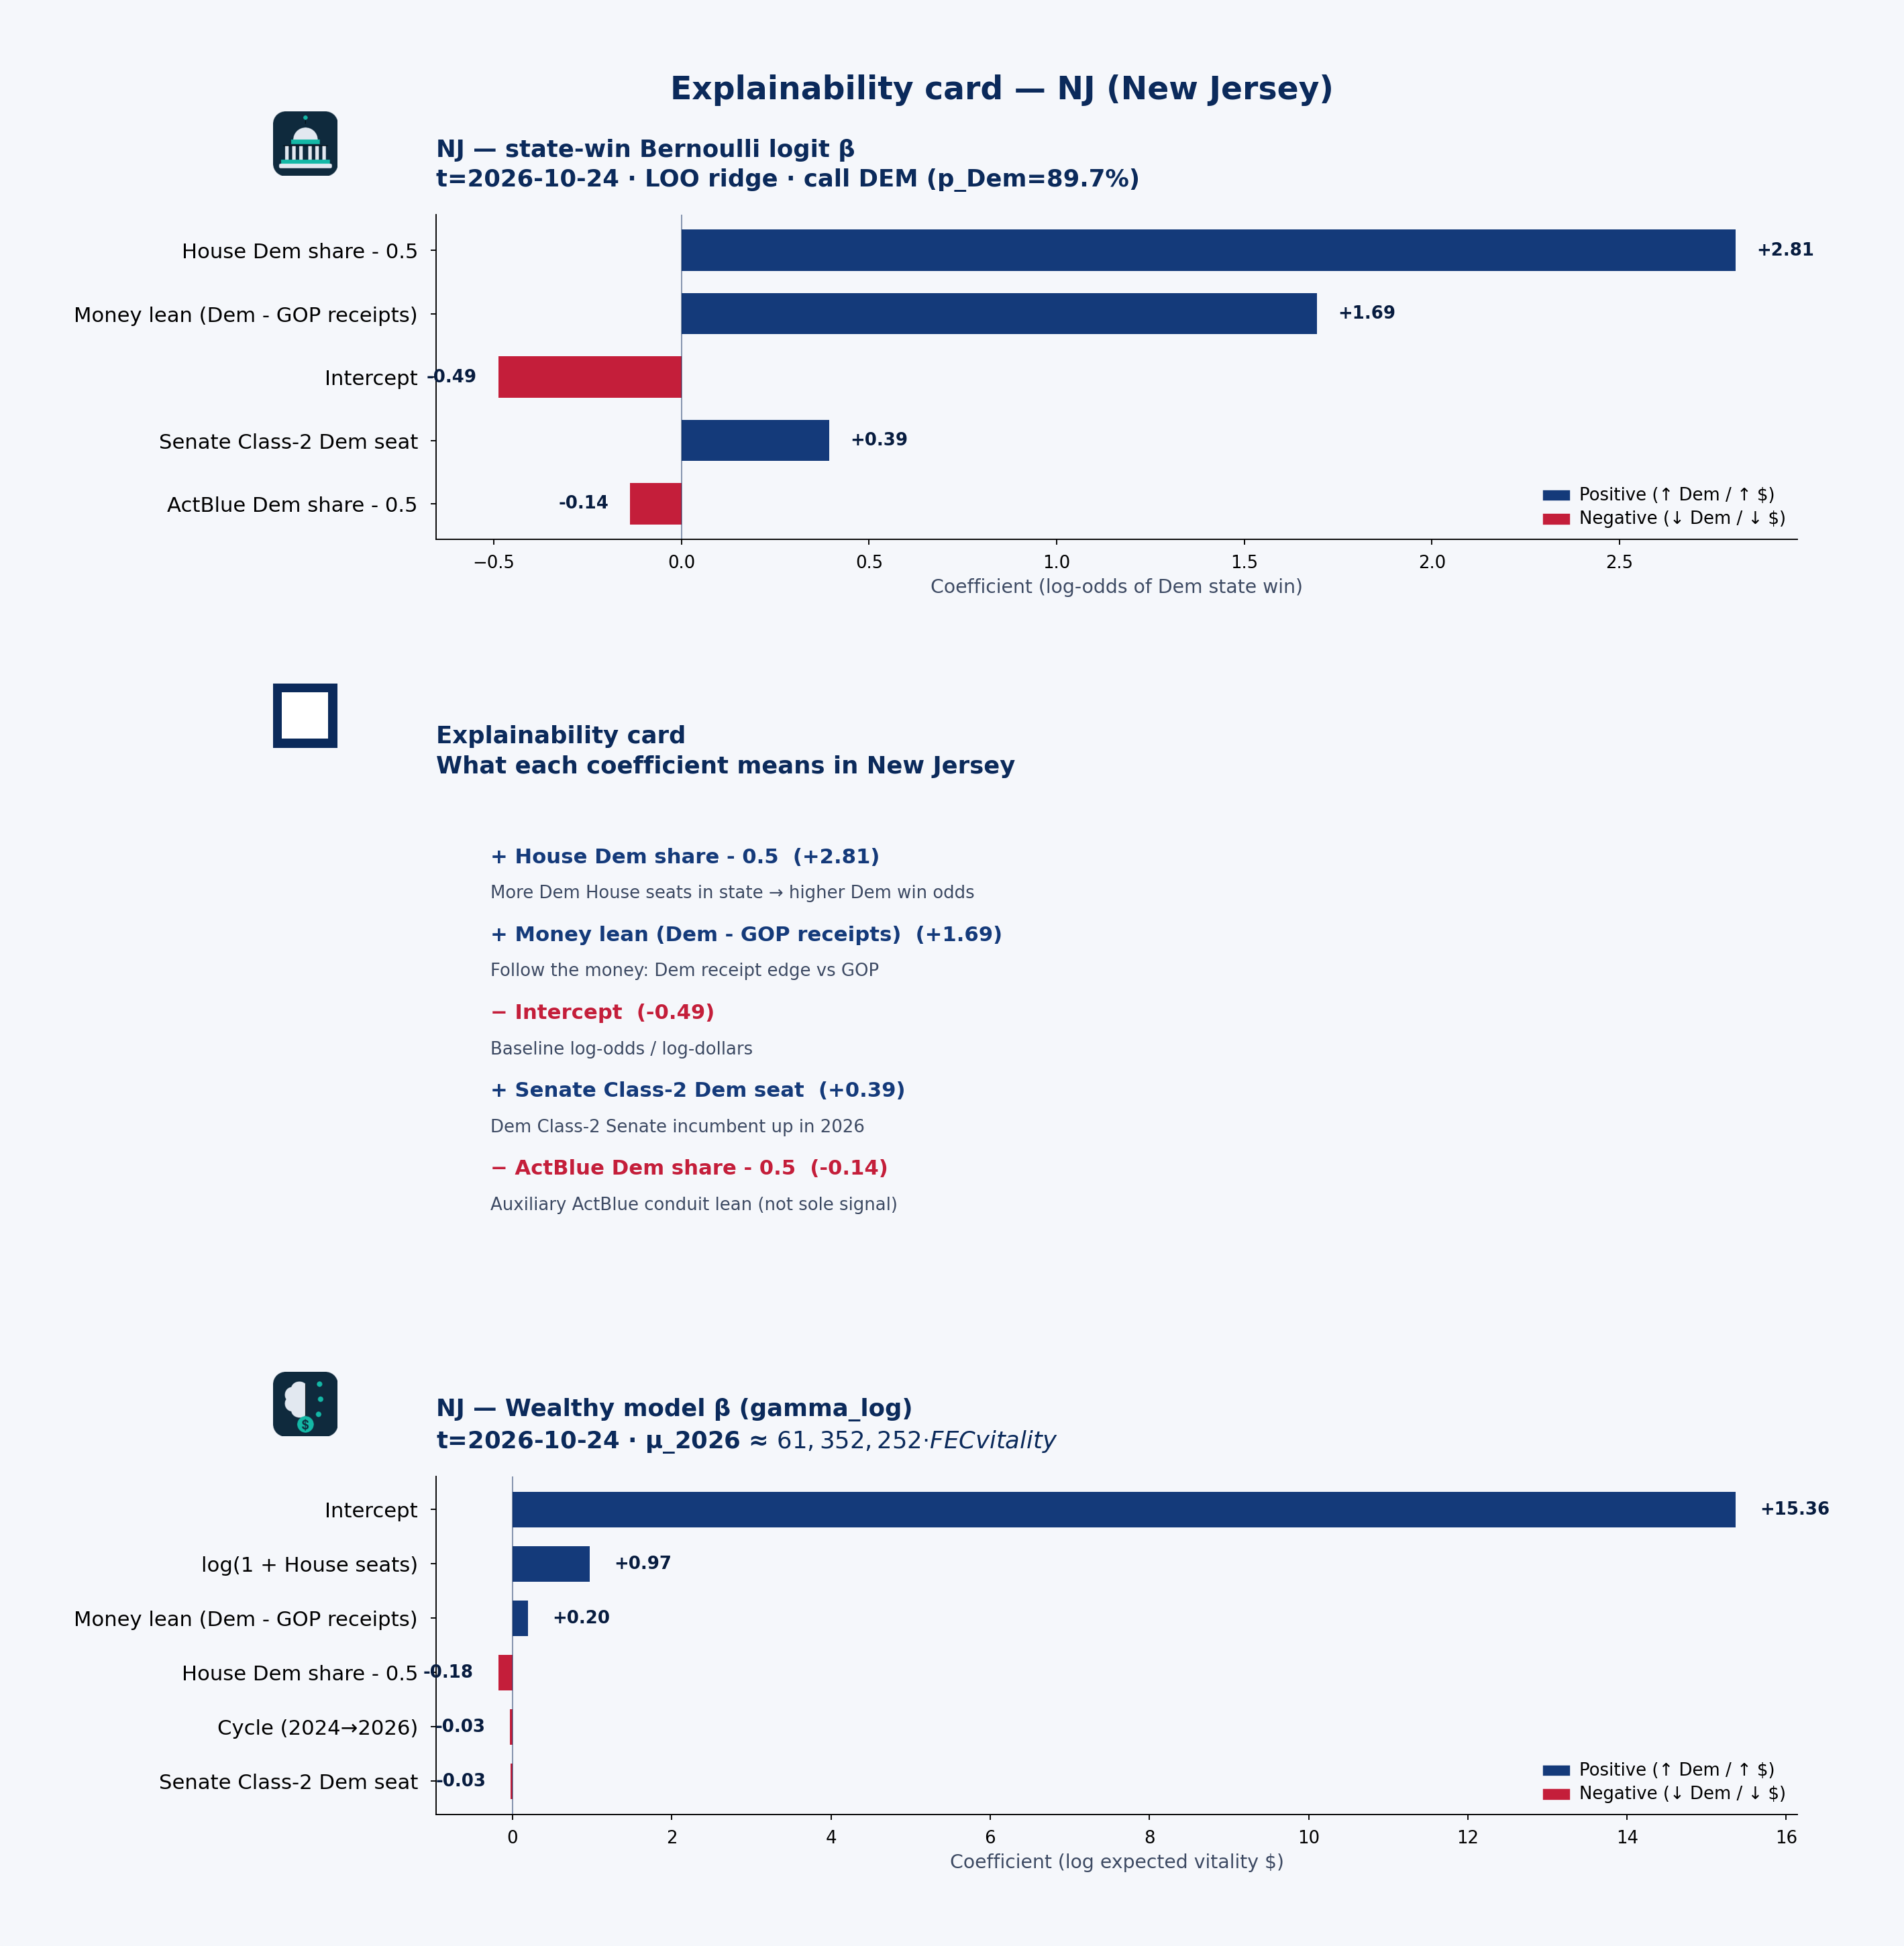 State explainability card · state-win LOO coefficient stability, plain language, and Wealthy model · NJ · t=2026-10-24
Statewide call: DEM (p_Dem=90%) · 2026 money shape: balanced
Receipts by cycle (campaign-finance weball)
| Cycle | Candidate | Total receipts | Individual | PAC (other pol. cmte) |
|---|---|---|---|---|
| 2024 | BOOKER, CORY A. | $7.92M | $4.23M | $17k |
| 2026 | BOOKER, CORY A. | $21.28M | $15.68M | $513k |
| 2024 | GOTTHEIMER, JOSH | $10.25M | $6.66M | $1.79M |
| 2026 | GOTTHEIMER, JOSH | $5.79M | $3.51M | $1.25M |
| 2024 | KEAN, THOMAS H. JR. | $6.02M | $3.38M | $1.39M |
| 2026 | KEAN, THOMAS H. JR. | $6.13M | $2.79M | $1.46M |
| 2024 | KIM, ANDY | $12.44M | $11.09M | $726k |
| 2026 | KIM, ANDY | $1.90M | $1.57M | $78k |
| 2024 | MCIVER, LAMONICA | $648k | $421k | $226k |
| 2026 | MCIVER, LAMONICA | $2.52M | $1.88M | $636k |
| 2024 | PALLONE, FRANK JR | $3.46M | $1.30M | $2.06M |
| 2026 | PALLONE, FRANK JR | $2.84M | $967k | $1.84M |
| 2024 | POU, NELIDA | $643k | $316k | $326k |
| 2026 | POU, NELIDA | $3.13M | $1.71M | $1.24M |
| 2024 | VAN DREW, JEFF MR | $3.23M | $2.68M | $441k |
| 2026 | VAN DREW, JEFF MR | $2.41M | $1.91M | $450k |
PAC & individual money
PAC money was about $10.20M of $52.35M total receipts in 2024 and $10.66M of $54.36M in 2026. Direct committee→candidate 24K (non-memo) ran about $10.18M (2024) / $9.35M (2026). Itemized individual share from New Jersey: 65.8% (2024) / 64.1% (2026).
BOOKER, CORY A.: Cycle-to-date weball receipts ~$21.28M, with PAC direct 24K $53k → $548k vs 2024. the public campaign-finance data feed by-size individual totals are not loaded in this 50-state snapshot.
Spotlight candidates
BOOKER, CORY A.
- In 2024, $4.23M of $7.92M came from individuals; PAC (other pol. cmte) $17k.
- In 2026, $15.68M of $21.28M came from individuals; PAC (other pol. cmte) $513k.
KIM, ANDY
- In 2024, $11.09M of $12.44M came from individuals; PAC (other pol. cmte) $726k.
- In 2026, $1.57M of $1.90M came from individuals; PAC (other pol. cmte) $78k.
GOTTHEIMER, JOSH
- In 2024, $6.66M of $10.25M came from individuals; PAC (other pol. cmte) $1.79M.
- In 2026, $3.51M of $5.79M came from individuals; PAC (other pol. cmte) $1.25M.
Short talking points — money & predicted voting
Open with the model set’s statewide call: DEM favored at about 90% Dem win probability on public campaign-finance + roster features — not a poll. Then the money shape: New Jersey federal candidates look balanced in 2026 weball (about $10.66M PAC / $34.84M individual of $54.36M total). Spotlight BOOKER, CORY A. for one concrete receipt picture. Close civic: these are public contribution patterns and a transparent forecast model call — not evidence of wrongdoing, and not a substitute for Cook or election-night counts.
NM — New Mexico
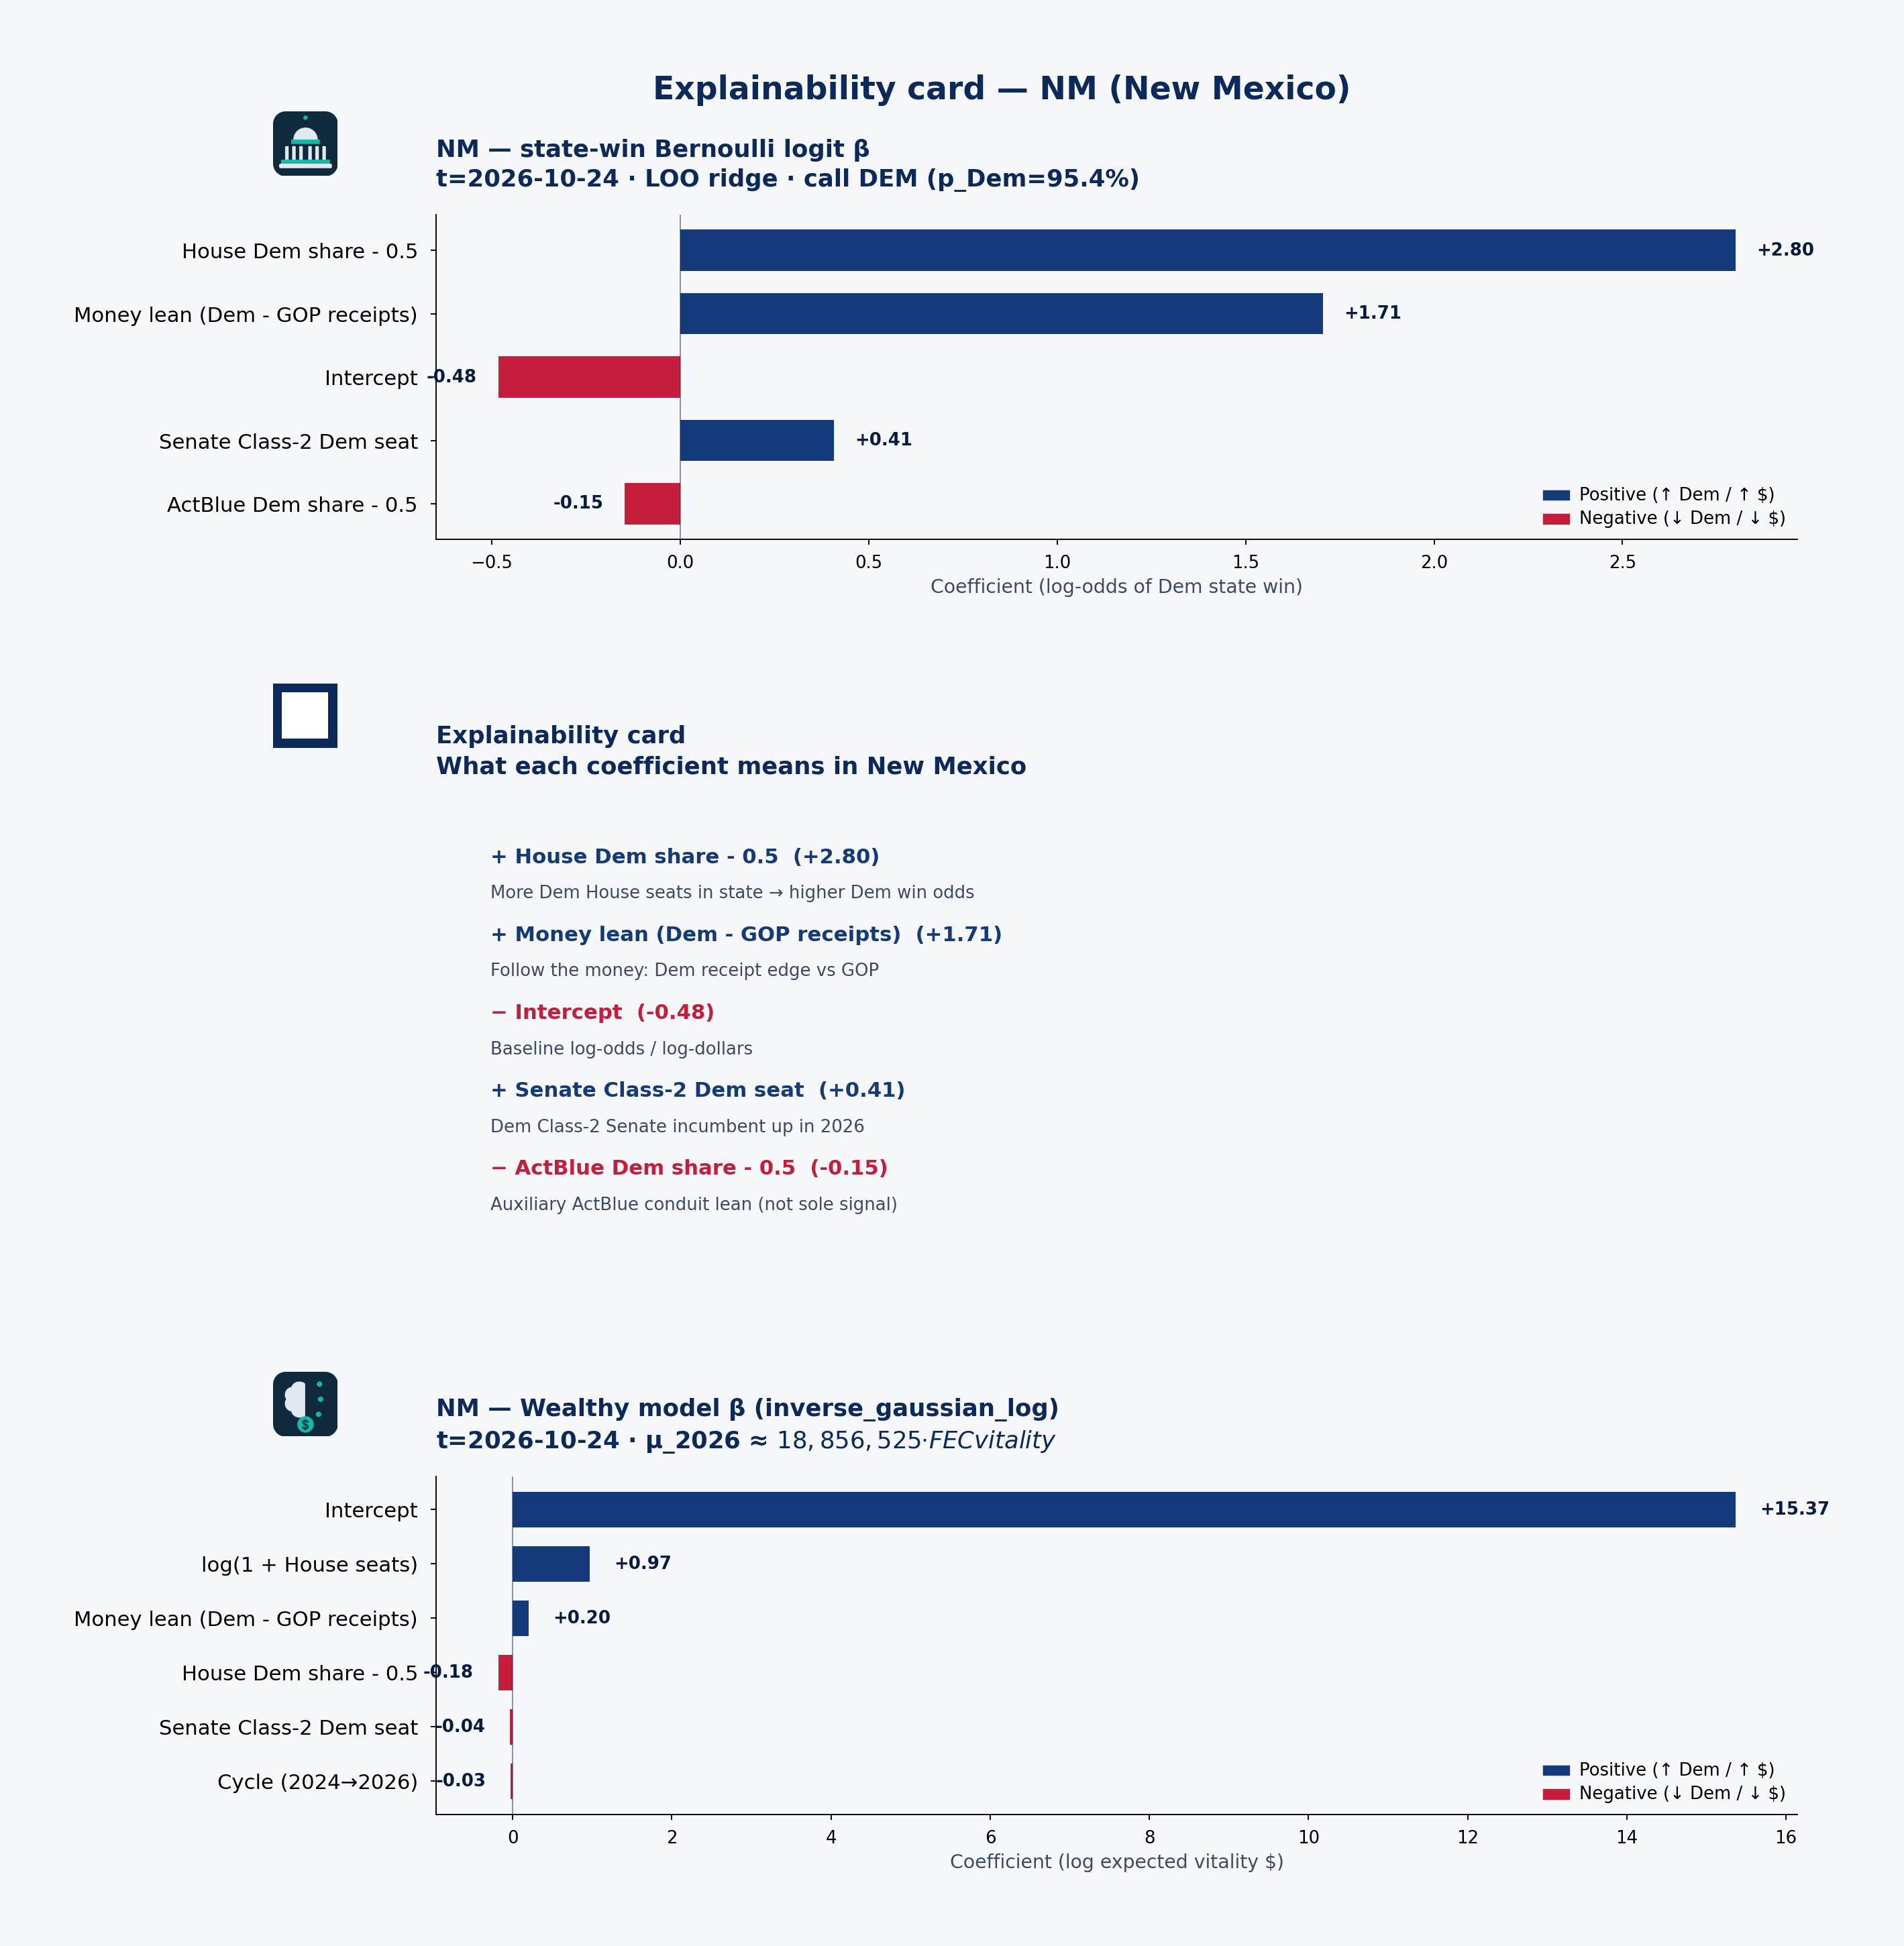 State explainability card · state-win LOO coefficient stability, plain language, and Wealthy model · NM · t=2026-10-24
Statewide call: DEM (p_Dem=95%) · 2026 money shape: balanced
Receipts by cycle (campaign-finance weball)
| Cycle | Candidate | Total receipts | Individual | PAC (other pol. cmte) |
|---|---|---|---|---|
| 2024 | HEINRICH, MARTIN | $10.73M | $8.10M | $2.00M |
| 2026 | HEINRICH, MARTIN | $1.71M | $1.18M | $506k |
| 2024 | LEGER FERNANDEZ, TERESA | $2.12M | $1.72M | $344k |
| 2026 | LEGER FERNANDEZ, TERESA | $1.58M | $1.26M | $295k |
| 2024 | LUJAN, BEN RAY | $1.36M | $1.07M | $268k |
| 2026 | LUJAN, BEN RAY | $6.46M | $3.37M | $2.08M |
| 2024 | STANSBURY, MELANIE | $1.35M | $961k | $339k |
| 2026 | STANSBURY, MELANIE | $1.72M | $1.43M | $264k |
| 2024 | VASQUEZ, GABRIEL | $7.04M | $5.31M | $1.32M |
| 2026 | VASQUEZ, GABRIEL | $5.52M | $3.74M | $1.37M |
PAC & individual money
PAC money was about $4.27M of $22.61M total receipts in 2024 and $4.51M of $16.99M in 2026. Direct committee→candidate 24K (non-memo) ran about $4.37M (2024) / $3.88M (2026). Itemized individual share from New Mexico: 75.9% (2024) / 64.7% (2026).
HEINRICH, MARTIN: Cycle-to-date weball receipts ~$1.71M, with PAC direct 24K $2.04M → $484k vs 2024. the public campaign-finance data feed by-size individual totals are not loaded in this 50-state snapshot.
Spotlight candidates
HEINRICH, MARTIN
- In 2024, $8.10M of $10.73M came from individuals; PAC (other pol. cmte) $2.00M.
- In 2026, $1.18M of $1.71M came from individuals; PAC (other pol. cmte) $506k.
VASQUEZ, GABRIEL
- In 2024, $5.31M of $7.04M came from individuals; PAC (other pol. cmte) $1.32M.
- In 2026, $3.74M of $5.52M came from individuals; PAC (other pol. cmte) $1.37M.
LUJAN, BEN RAY
- In 2024, $1.07M of $1.36M came from individuals; PAC (other pol. cmte) $268k.
- In 2026, $3.37M of $6.46M came from individuals; PAC (other pol. cmte) $2.08M.
Short talking points — money & predicted voting
Open with the model set’s statewide call: DEM favored at about 95% Dem win probability on public campaign-finance + roster features — not a poll. Then the money shape: New Mexico federal candidates look balanced in 2026 weball (about $4.51M PAC / $10.98M individual of $16.99M total). Spotlight HEINRICH, MARTIN for one concrete receipt picture. Close civic: these are public contribution patterns and a transparent forecast model call — not evidence of wrongdoing, and not a substitute for Cook or election-night counts.
NV — Nevada
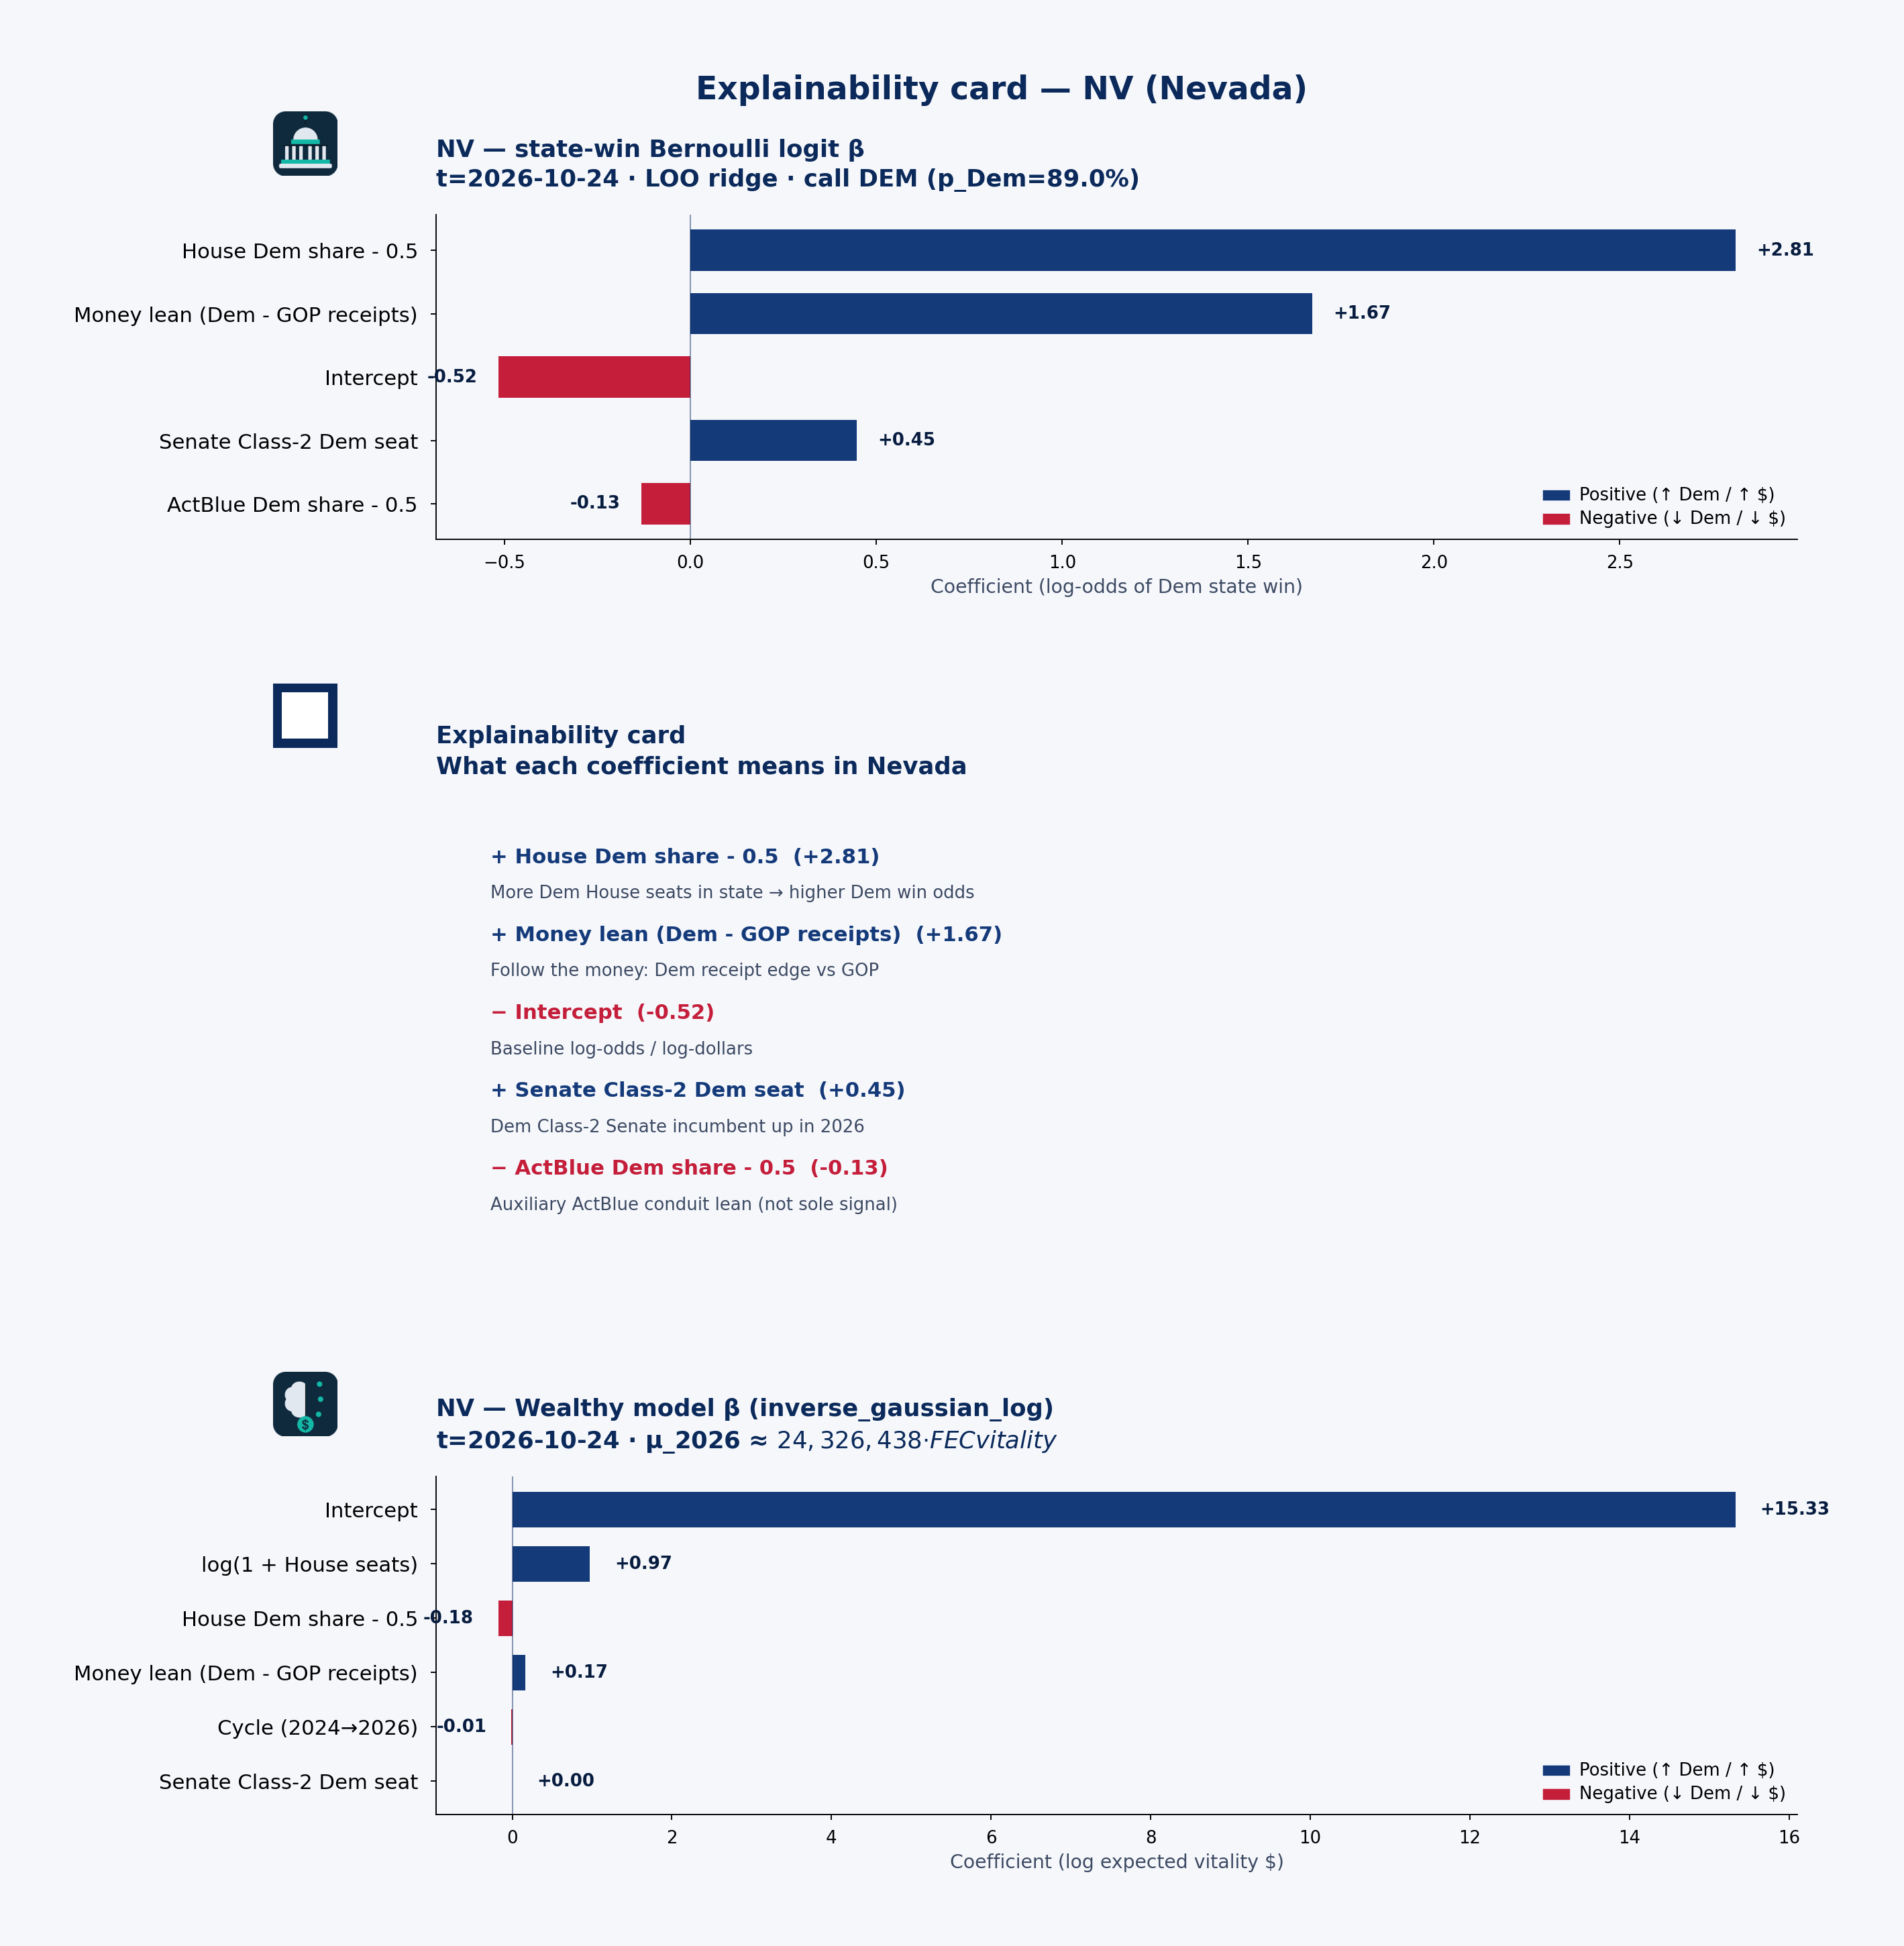 State explainability card · state-win LOO coefficient stability, plain language, and Wealthy model · NV · t=2026-10-24
Statewide call: DEM (p_Dem=89%) · 2026 money shape: balanced
Receipts by cycle (campaign-finance weball)
| Cycle | Candidate | Total receipts | Individual | PAC (other pol. cmte) |
|---|---|---|---|---|
| 2024 | BROWN, SAM | $24.06M | $20.61M | $1.08M |
| 2024 | HORSFORD, STEVEN ALEXZANDER | $5.44M | $2.74M | $2.54M |
| 2026 | HORSFORD, STEVEN ALEXZANDER | $4.08M | $1.59M | $2.21M |
| 2024 | KIDD, GREG | $9.20M | $0 | $0 |
| 2026 | KIDD, GREG | $1.23M | $0 | $0 |
| 2024 | LEE, SUSIE | $6.07M | $4.22M | $1.48M |
| 2026 | LEE, SUSIE | $5.94M | $3.67M | $1.61M |
| 2024 | O'DONNELL, MARTY | $1.25M | $46k | $0 |
| 2026 | O'DONNELL, MARTY | $4.84M | $710k | $329k |
| 2026 | O'DONNELL, MARTY | $4.86M | $710k | $329k |
| 2024 | ROSEN, JACKY | $43.92M | $33.77M | $2.57M |
| 2024 | ROSEN, JACKY | $43.92M | $33.77M | $2.57M |
| 2026 | ROSEN, JACKY | $1.80M | $1.27M | $264k |
| 2026 | ROSEN, JACKY | $1.80M | $1.27M | $264k |
PAC & individual money
PAC money was about $12.22M of $155.17M total receipts in 2024 and $7.12M of $41.88M in 2026. Direct committee→candidate 24K (non-memo) ran about $8.84M (2024) / $5.18M (2026). Itemized individual share from Nevada: 67.0% (2024) / 43.2% (2026).
ROSEN, JACKY: Cycle-to-date weball receipts ~$1.80M, with PAC direct 24K $47k → $500 vs 2024. the public campaign-finance data feed by-size individual totals are not loaded in this 50-state snapshot.
Spotlight candidates
ROSEN, JACKY
- In 2024, $33.77M of $43.92M came from individuals; PAC (other pol. cmte) $2.57M.
- In 2026, $1.27M of $1.80M came from individuals; PAC (other pol. cmte) $264k.
ROSEN, JACKY
- In 2024, $33.77M of $43.92M came from individuals; PAC (other pol. cmte) $2.57M.
- In 2026, $1.27M of $1.80M came from individuals; PAC (other pol. cmte) $264k.
BROWN, SAM
- In 2024, $20.61M of $24.06M came from individuals; PAC (other pol. cmte) $1.08M.
Short talking points — money & predicted voting
Open with the model set’s statewide call: DEM favored at about 89% Dem win probability on public campaign-finance + roster features — not a poll. Then the money shape: Nevada federal candidates look balanced in 2026 weball (about $7.12M PAC / $18.10M individual of $41.88M total). Spotlight ROSEN, JACKY for one concrete receipt picture. Close civic: these are public contribution patterns and a transparent forecast model call — not evidence of wrongdoing, and not a substitute for Cook or election-night counts.
NY — New York
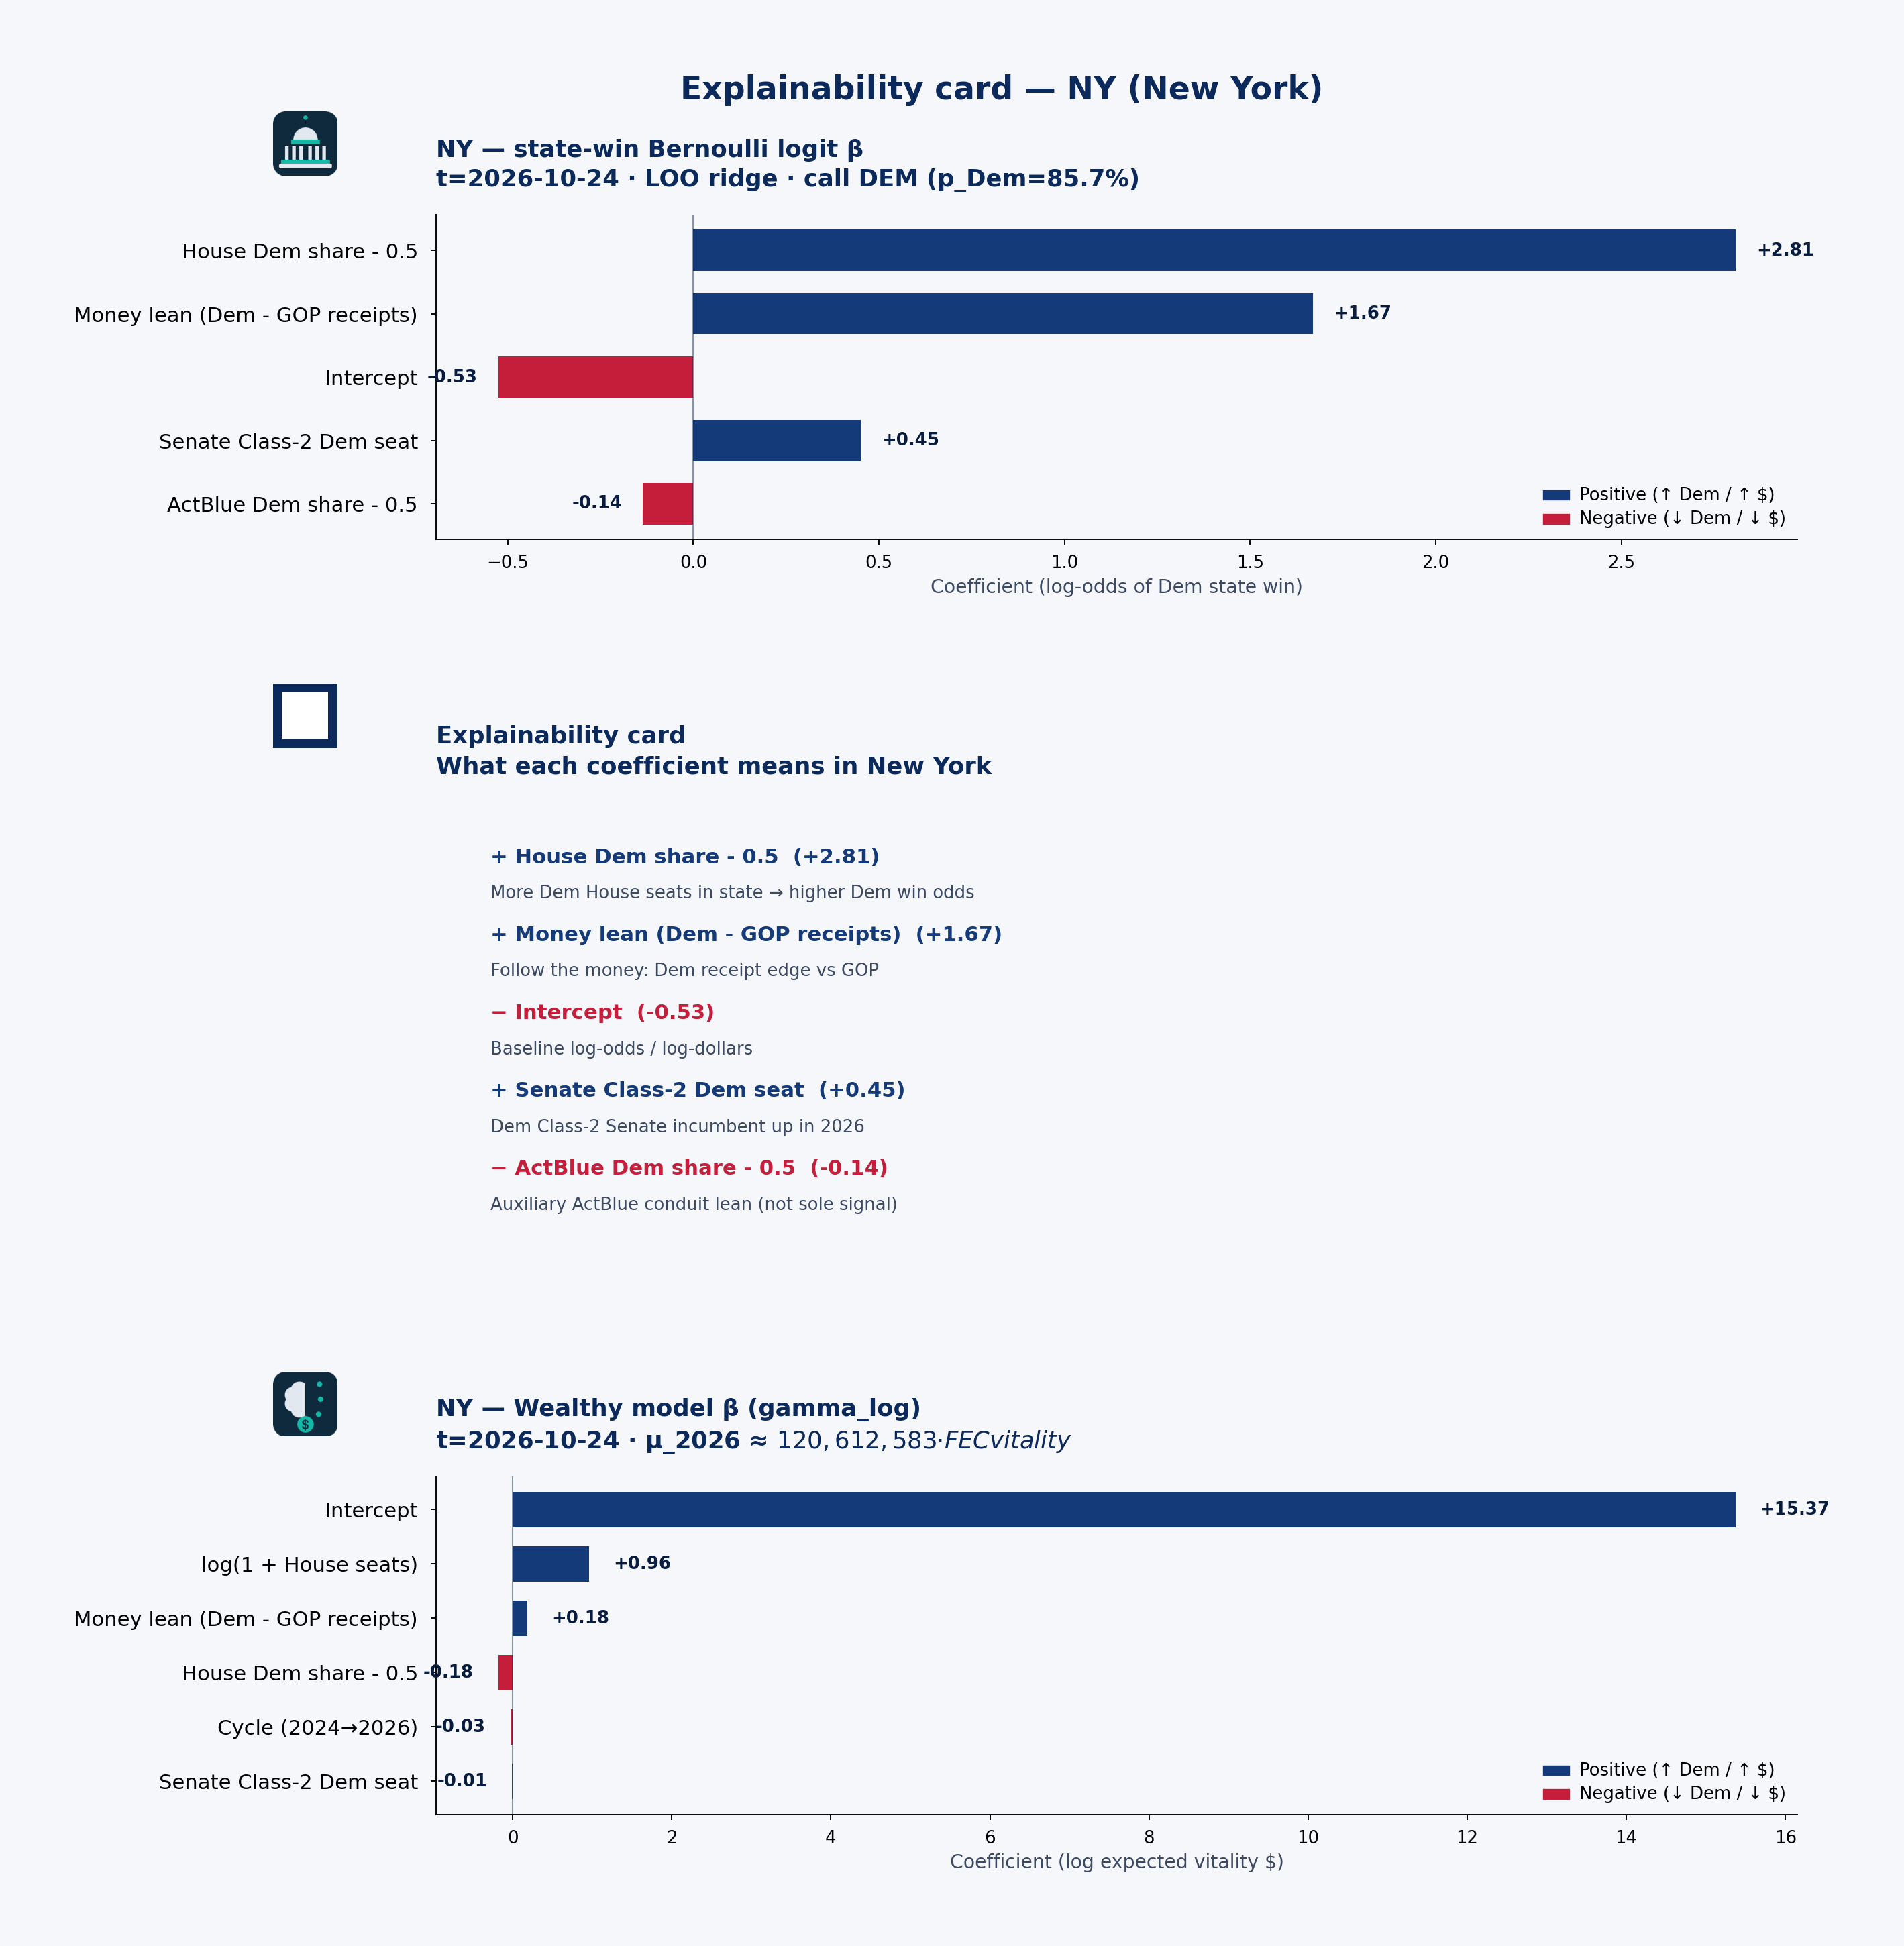 State explainability card · state-win LOO coefficient stability, plain language, and Wealthy model · NY · t=2026-10-24
Statewide call: DEM (p_Dem=86%) · 2026 money shape: individual-heavy
Receipts by cycle (campaign-finance weball)
| Cycle | Candidate | Total receipts | Individual | PAC (other pol. cmte) |
|---|---|---|---|---|
| 2026 | CHATZKY, PETER | $11.71M | $349k | $0 |
| 2026 | CONLEY, CAIT | $10.71M | $9.39M | $523k |
| 2024 | CONSTANTINO, ANTHONY THOMAS | $2.60M | $0 | $0 |
| 2026 | CONSTANTINO, ANTHONY THOMAS | $14.46M | $0 | $7k |
| 2024 | JEFFRIES, HAKEEM | $22.98M | $15.94M | $2.64M |
| 2026 | JEFFRIES, HAKEEM | $17.89M | $12.69M | $2.77M |
| 2024 | JONES, MONDAIRE | $9.96M | $7.76M | $633k |
| 2026 | JONES, MONDAIRE | $15k | $0 | $0 |
| 2024 | LAWLER, MICHAEL VINCENT | $8.39M | $3.86M | $2.33M |
| 2026 | LAWLER, MICHAEL VINCENT | $10.32M | $3.97M | $2.49M |
| 2024 | OCASIO-CORTEZ, ALEXANDRIA | $15.30M | $14.87M | $45k |
| 2026 | OCASIO-CORTEZ, ALEXANDRIA | $38.03M | $37.24M | $46k |
| 2024 | STEFANIK, ELISE M. | $15.47M | $5.53M | $1.08M |
| 2026 | STEFANIK, ELISE M. | $5.01M | $2.43M | $290k |
PAC & individual money
PAC money was about $33.28M of $225.03M total receipts in 2024 and $29.23M of $254.06M in 2026. Direct committee→candidate 24K (non-memo) ran about $33.67M (2024) / $24.47M (2026). Itemized individual share from New York: 63.6% (2024) / 61.5% (2026).
OCASIO-CORTEZ, ALEXANDRIA: Cycle-to-date weball receipts ~$38.03M, with PAC direct 24K $51k → $38k vs 2024. the public campaign-finance data feed by-size individual totals are not loaded in this 50-state snapshot.
Spotlight candidates
OCASIO-CORTEZ, ALEXANDRIA
- In 2024, $14.87M of $15.30M came from individuals; PAC (other pol. cmte) $45k.
- In 2026, $37.24M of $38.03M came from individuals; PAC (other pol. cmte) $46k.
JEFFRIES, HAKEEM
- In 2024, $15.94M of $22.98M came from individuals; PAC (other pol. cmte) $2.64M.
- In 2026, $12.69M of $17.89M came from individuals; PAC (other pol. cmte) $2.77M.
STEFANIK, ELISE M.
- In 2024, $5.53M of $15.47M came from individuals; PAC (other pol. cmte) $1.08M.
- In 2026, $2.43M of $5.01M came from individuals; PAC (other pol. cmte) $290k.
Short talking points — money & predicted voting
Open with the model set’s statewide call: DEM favored at about 86% Dem win probability on public campaign-finance + roster features — not a poll. Then the money shape: New York federal candidates look individual-heavy in 2026 weball (about $29.23M PAC / $156.22M individual of $254.06M total). Spotlight OCASIO-CORTEZ, ALEXANDRIA for one concrete receipt picture. Close civic: these are public contribution patterns and a transparent forecast model call — not evidence of wrongdoing, and not a substitute for Cook or election-night counts.
OH — Ohio
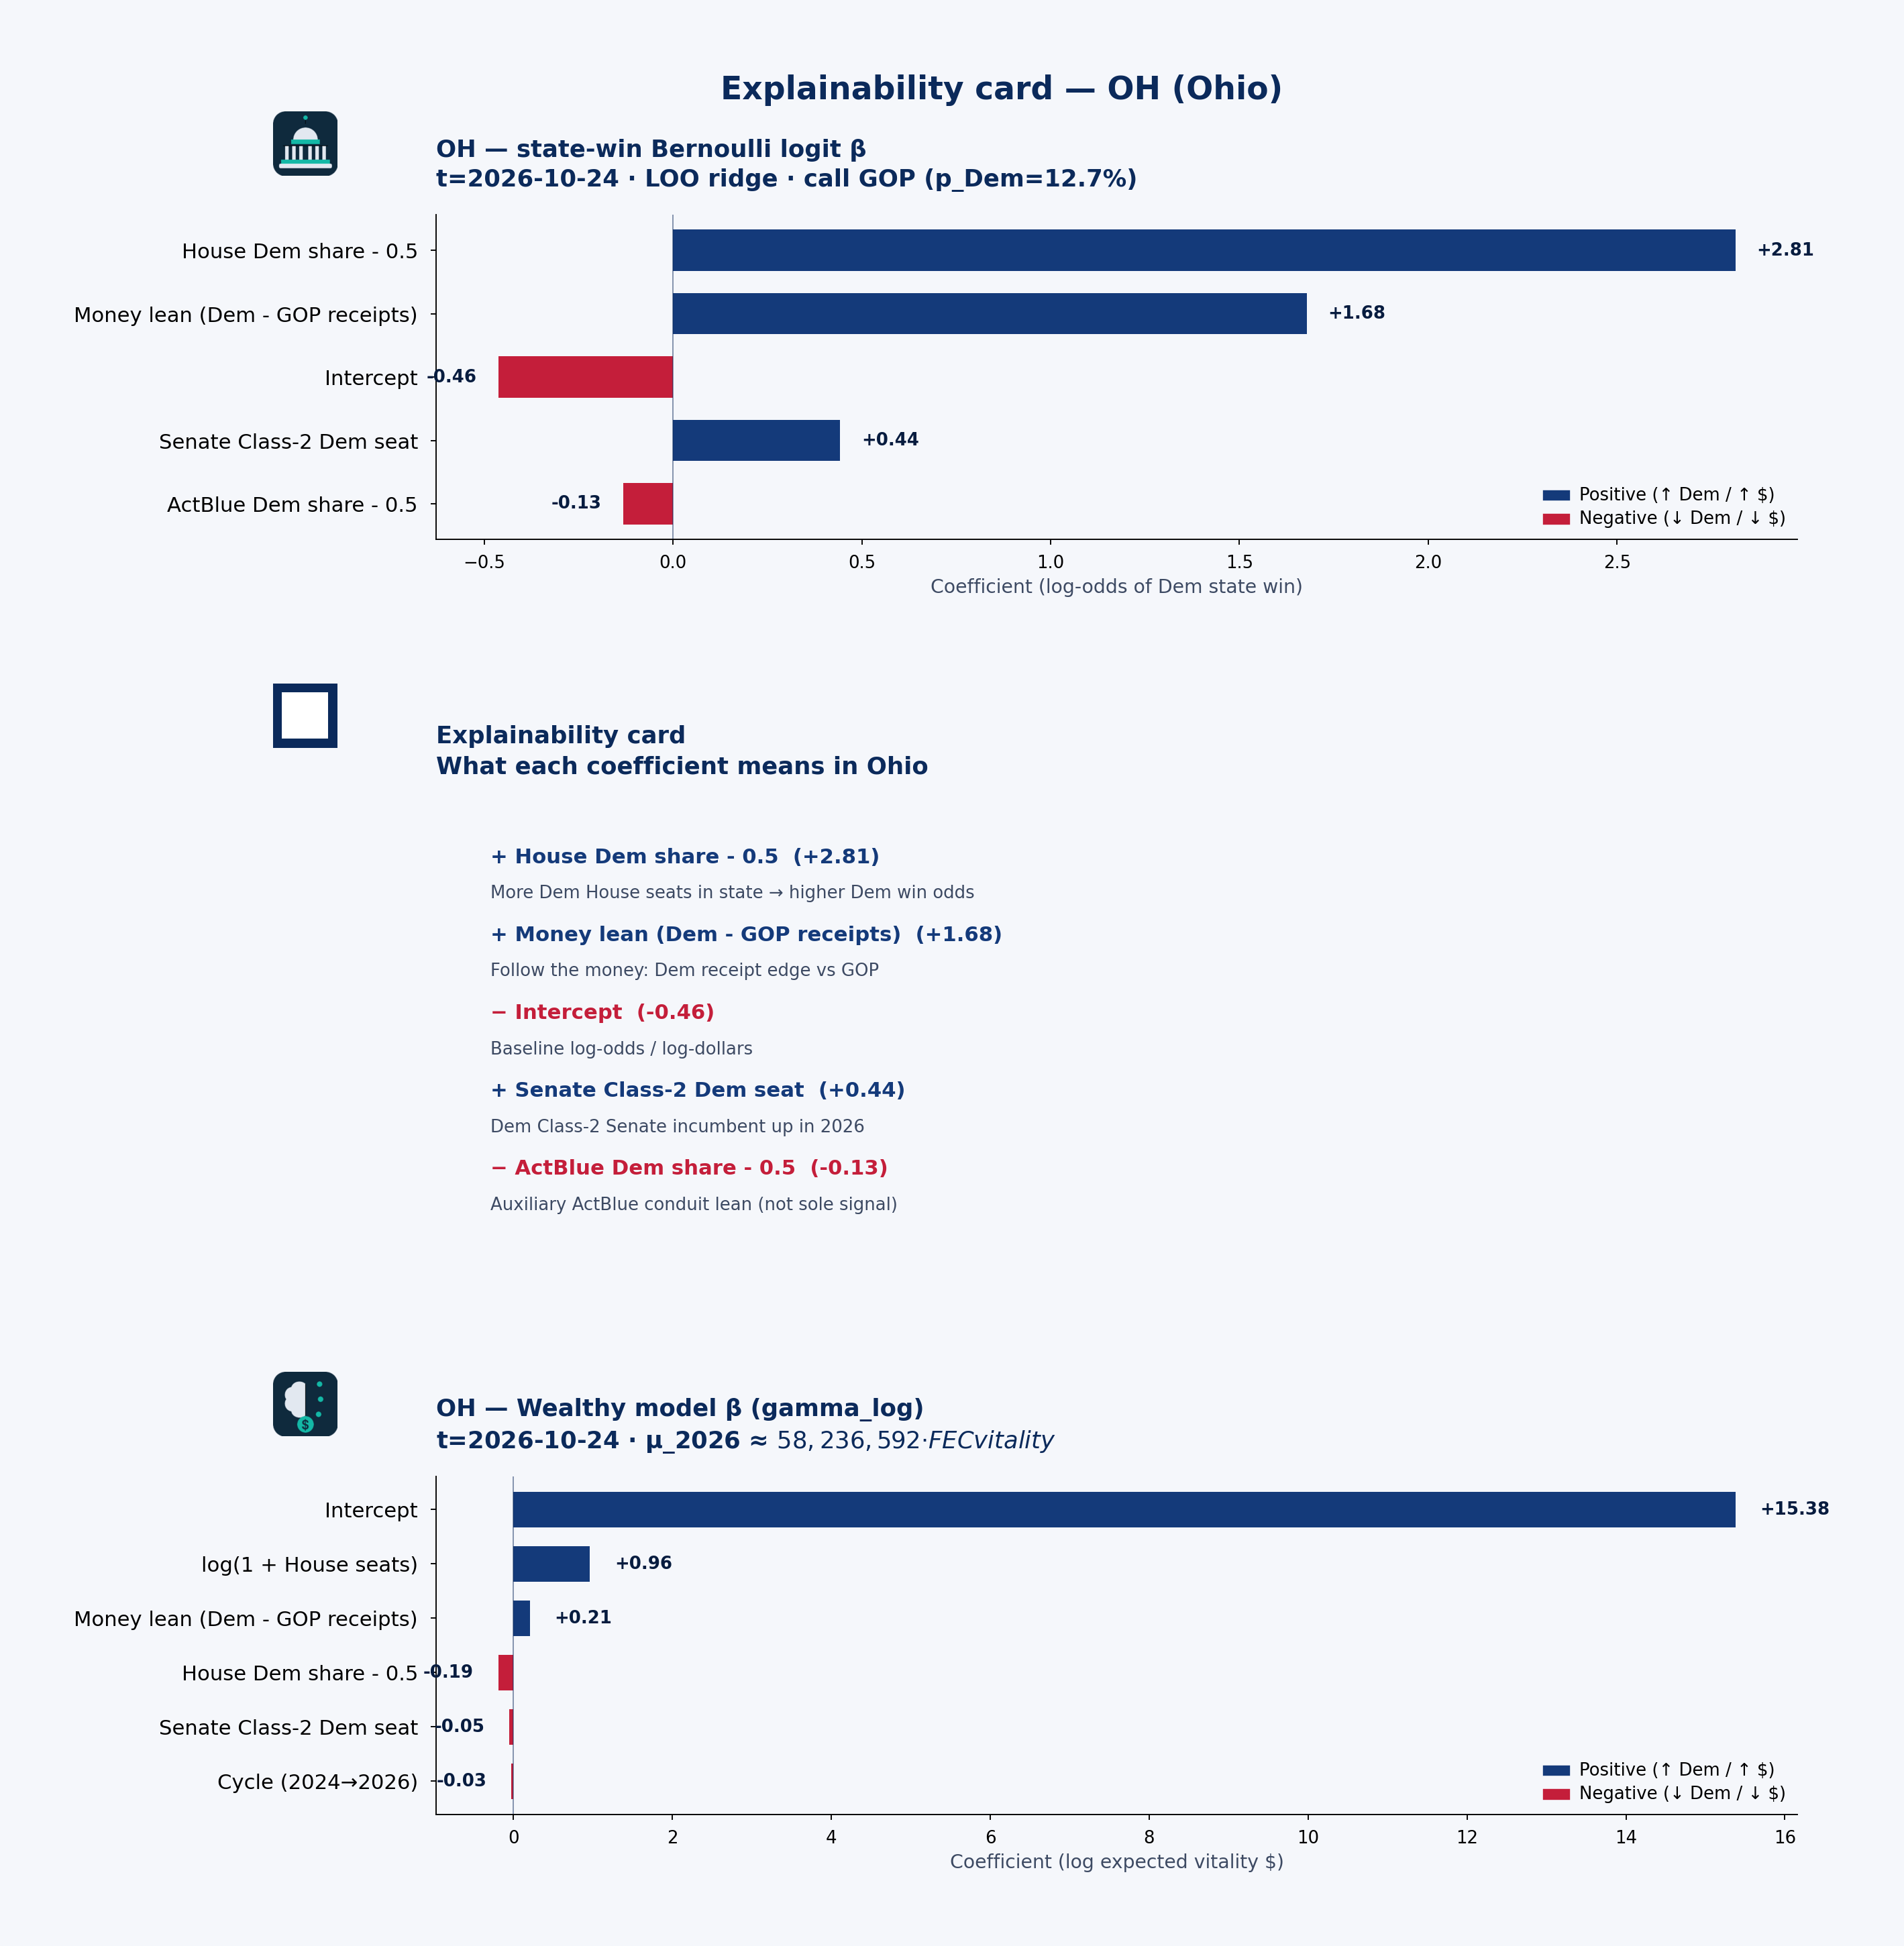 State explainability card · state-win LOO coefficient stability, plain language, and Wealthy model · OH · t=2026-10-24
Statewide call: GOP (p_Dem=13%) · 2026 money shape: individual-heavy
Receipts by cycle (campaign-finance weball)
| Cycle | Candidate | Total receipts | Individual | PAC (other pol. cmte) |
|---|---|---|---|---|
| 2024 | BROWN, SHERROD | $96.53M | $79.88M | $3.09M |
| 2026 | BROWN, SHERROD | $68.41M | $57.86M | $1.06M |
| 2024 | DOLAN, MATT | $12.72M | $2.37M | $50k |
| 2026 | DOLAN, MATT | $1k | $0 | $0 |
| 2026 | HUSTED, JON | $19.89M | $9.84M | $2.73M |
| 2024 | JORDAN, JAMES D. | $13.43M | $11.97M | $448k |
| 2026 | JORDAN, JAMES D. | $5.62M | $3.91M | $636k |
| 2024 | KAPTUR, MARCY HON. M.C. | $5.06M | $2.89M | $1.49M |
| 2026 | KAPTUR, MARCY HON. M.C. | $5.91M | $3.45M | $1.51M |
| 2024 | LANDSMAN, GREG | $3.72M | $2.68M | $941k |
| 2026 | LANDSMAN, GREG | $5.66M | $3.55M | $1.20M |
| 2024 | MORENO, BERNIE | $26.92M | $14.81M | $910k |
| 2026 | MORENO, BERNIE | $3.24M | $877k | $308k |
| 2024 | SYKES, EMILIA | $5.33M | $3.36M | $1.45M |
| 2026 | SYKES, EMILIA | $3.99M | $2.51M | $1.26M |
PAC & individual money
PAC money was about $20.88M of $208.89M total receipts in 2024 and $20.97M of $157.71M in 2026. Direct committee→candidate 24K (non-memo) ran about $21.26M (2024) / $17.77M (2026). Itemized individual share from Ohio: 67.0% (2024) / 67.6% (2026).
BROWN, SHERROD: Cycle-to-date weball receipts ~$68.41M, with PAC direct 24K $3.22M → $220k vs 2024. the public campaign-finance data feed by-size individual totals are not loaded in this 50-state snapshot.
Spotlight candidates
BROWN, SHERROD
- In 2024, $79.88M of $96.53M came from individuals; PAC (other pol. cmte) $3.09M.
- In 2026, $57.86M of $68.41M came from individuals; PAC (other pol. cmte) $1.06M.
MORENO, BERNIE
- In 2024, $14.81M of $26.92M came from individuals; PAC (other pol. cmte) $910k.
- In 2026, $877k of $3.24M came from individuals; PAC (other pol. cmte) $308k.
HUSTED, JON
- In 2026, $9.84M of $19.89M came from individuals; PAC (other pol. cmte) $2.73M.
Short talking points — money & predicted voting
Open with the model set’s statewide call: GOP favored at about 13% Dem win probability on public campaign-finance + roster features — not a poll. Then the money shape: Ohio federal candidates look individual-heavy in 2026 weball (about $20.97M PAC / $106.62M individual of $157.71M total). Spotlight BROWN, SHERROD for one concrete receipt picture. Close civic: these are public contribution patterns and a transparent forecast model call — not evidence of wrongdoing, and not a substitute for Cook or election-night counts.
OK — Oklahoma
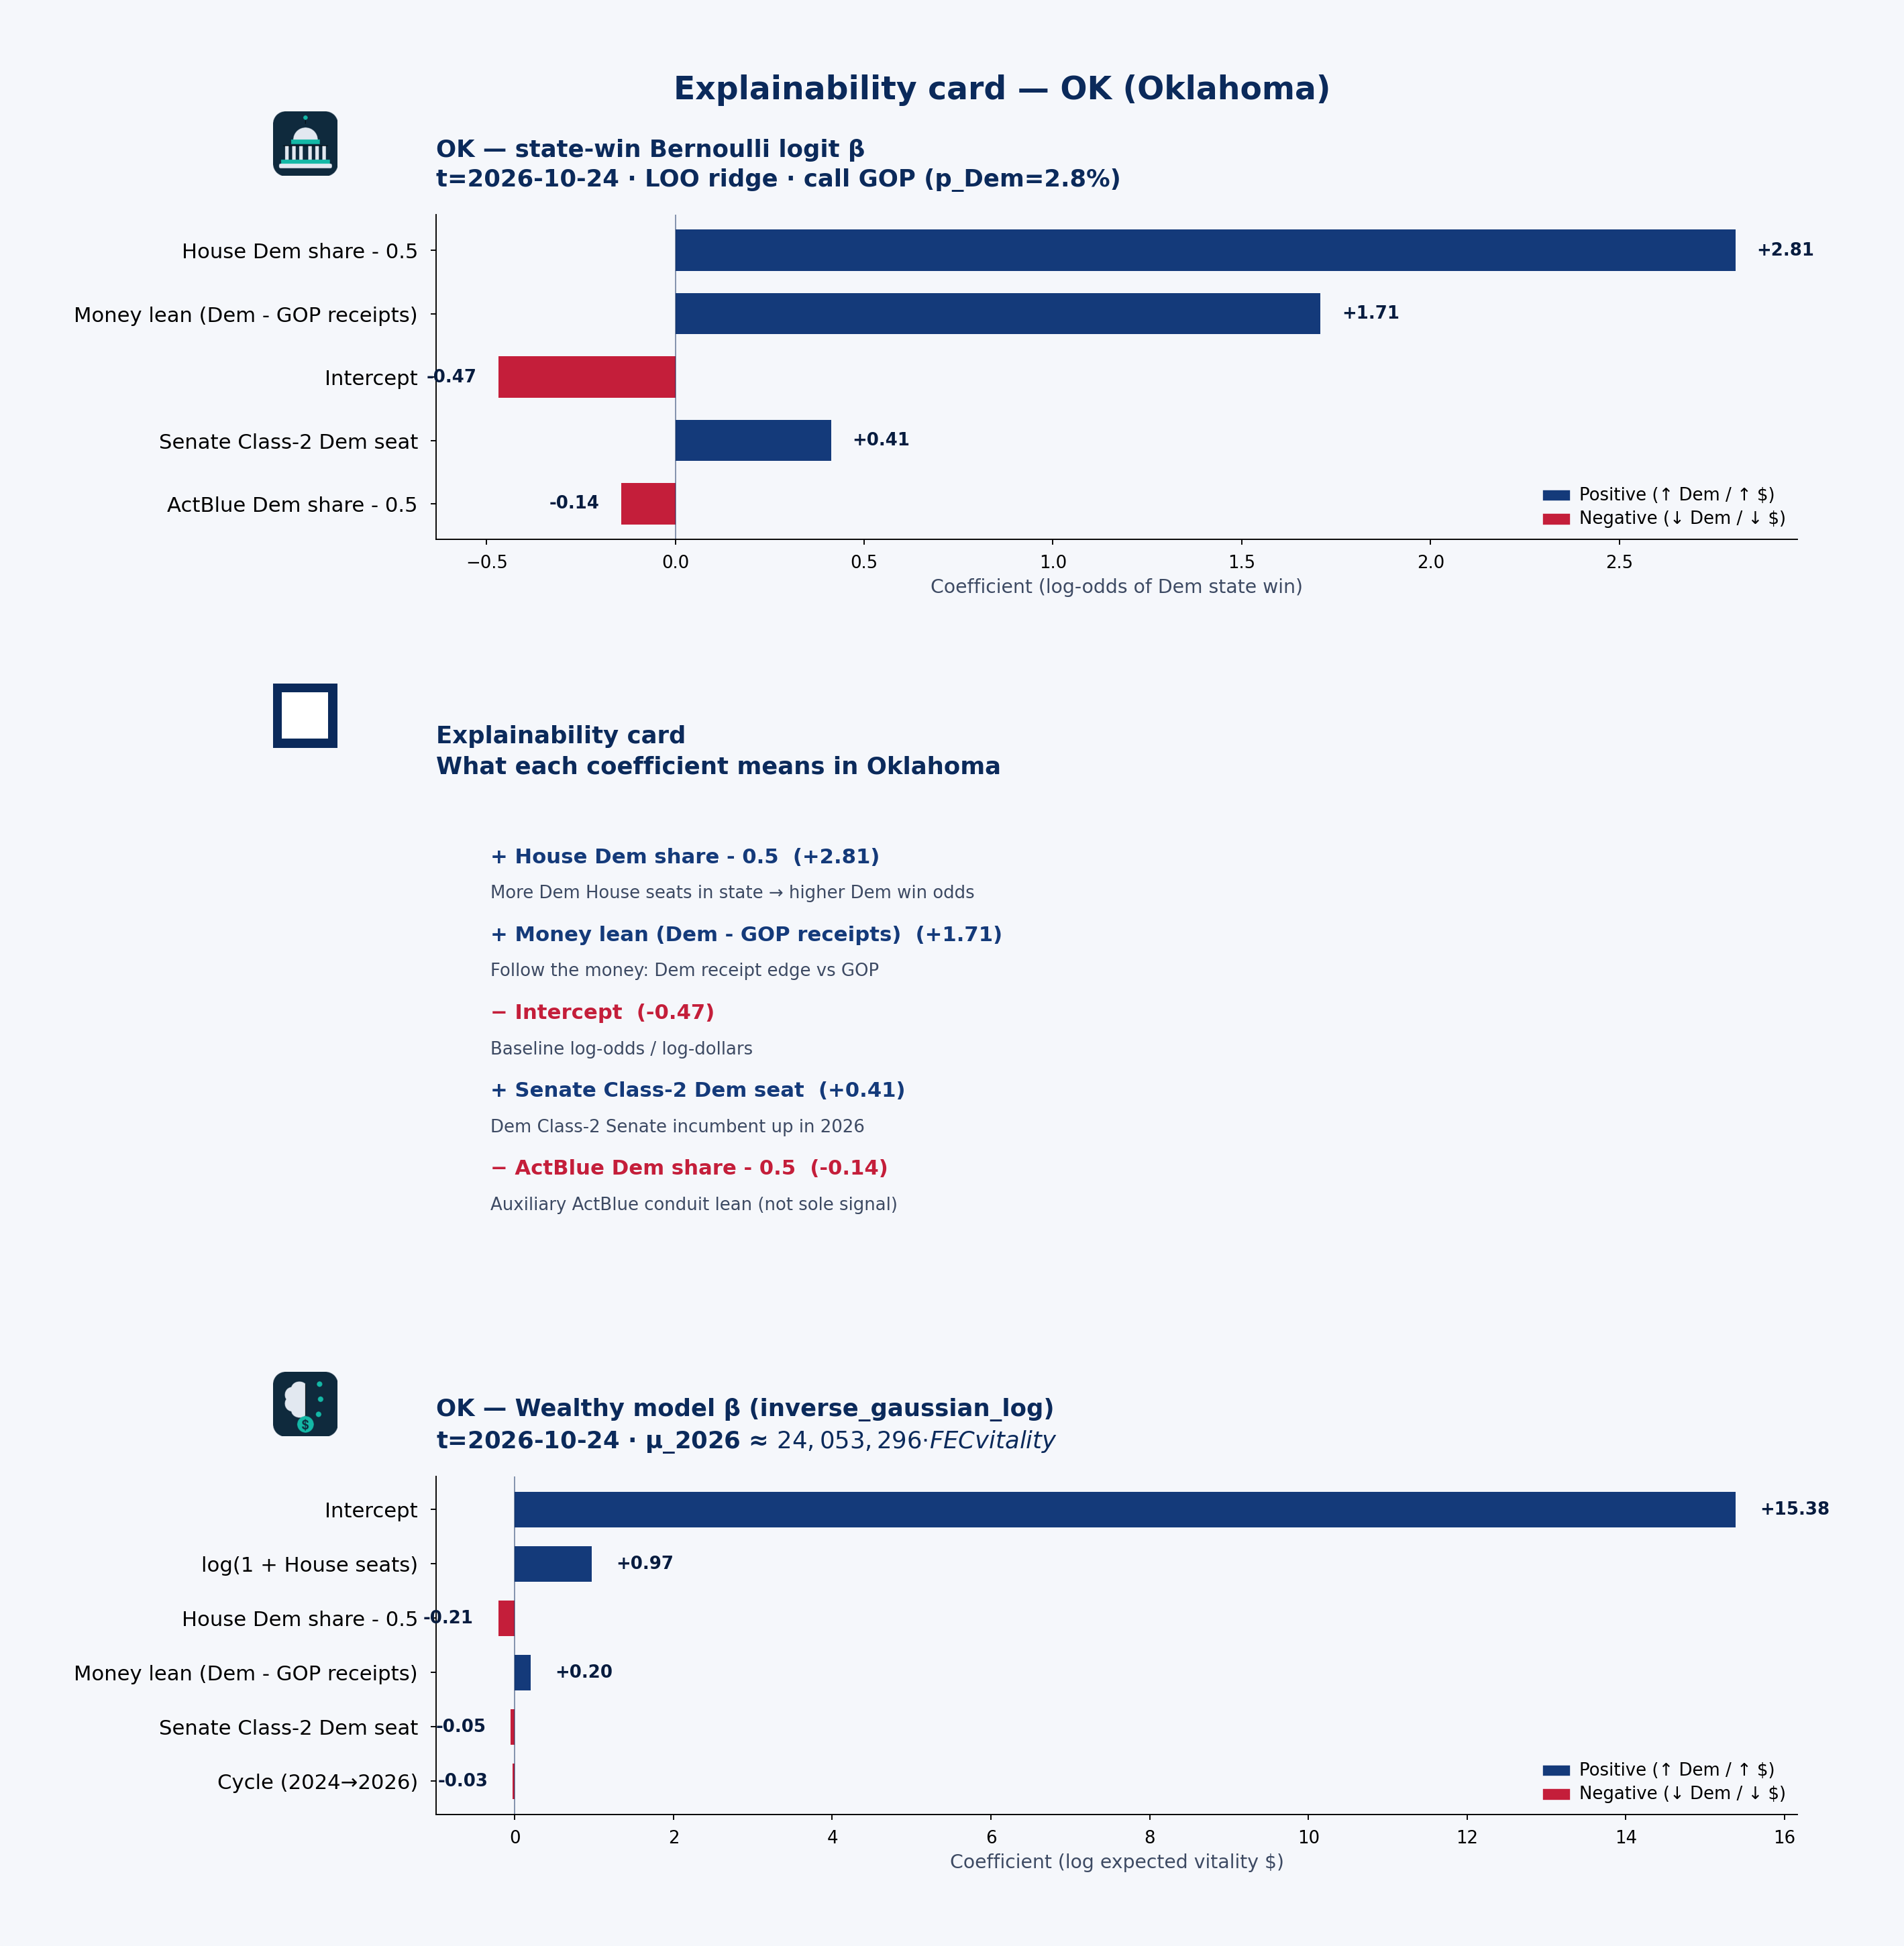 State explainability card · state-win LOO coefficient stability, plain language, and Wealthy model · OK · t=2026-10-24
Statewide call: GOP (p_Dem=3%) · 2026 money shape: balanced
Receipts by cycle (campaign-finance weball)
| Cycle | Candidate | Total receipts | Individual | PAC (other pol. cmte) |
|---|---|---|---|---|
| 2024 | BICE, STEPHANIE | $2.11M | $911k | $905k |
| 2026 | BICE, STEPHANIE | $2.48M | $664k | $1.26M |
| 2024 | BRECHEEN, JOSH | $335k | $238k | $94k |
| 2026 | BRECHEEN, JOSH | $250k | $122k | $128k |
| 2024 | COLE, TOM | $5.59M | $2.98M | $2.50M |
| 2026 | COLE, TOM | $4.28M | $2.24M | $1.84M |
| 2026 | HERN, KEVIN | $10.86M | $1.50M | $1.03M |
| 2024 | LANKFORD, JAMES PAUL | $914k | $390k | $351k |
| 2026 | LANKFORD, JAMES PAUL | $1.17M | $472k | $398k |
| 2024 | LUCAS, FRANK D. | $1.73M | $594k | $1.12M |
| 2026 | LUCAS, FRANK D. | $1.06M | $233k | $809k |
PAC & individual money
PAC money was about $4.97M of $10.68M total receipts in 2024 and $5.47M of $20.10M in 2026. Direct committee→candidate 24K (non-memo) ran about $5.05M (2024) / $5.01M (2026). Itemized individual share from Oklahoma: 47.9% (2024) / 26.0% (2026).
HERN, KEVIN: Cycle-to-date weball receipts ~$10.86M, with PAC direct 24K $0 → $871k vs 2024. the public campaign-finance data feed by-size individual totals are not loaded in this 50-state snapshot.
Spotlight candidates
HERN, KEVIN
- In 2026, $1.50M of $10.86M came from individuals; PAC (other pol. cmte) $1.03M.
COLE, TOM
- In 2024, $2.98M of $5.59M came from individuals; PAC (other pol. cmte) $2.50M.
- In 2026, $2.24M of $4.28M came from individuals; PAC (other pol. cmte) $1.84M.
BICE, STEPHANIE
- In 2024, $911k of $2.11M came from individuals; PAC (other pol. cmte) $905k.
- In 2026, $664k of $2.48M came from individuals; PAC (other pol. cmte) $1.26M.
Short talking points — money & predicted voting
Open with the model set’s statewide call: GOP favored at about 3% Dem win probability on public campaign-finance + roster features — not a poll. Then the money shape: Oklahoma federal candidates look balanced in 2026 weball (about $5.47M PAC / $5.23M individual of $20.10M total). Spotlight HERN, KEVIN for one concrete receipt picture. Close civic: these are public contribution patterns and a transparent forecast model call — not evidence of wrongdoing, and not a substitute for Cook or election-night counts.
OR — Oregon
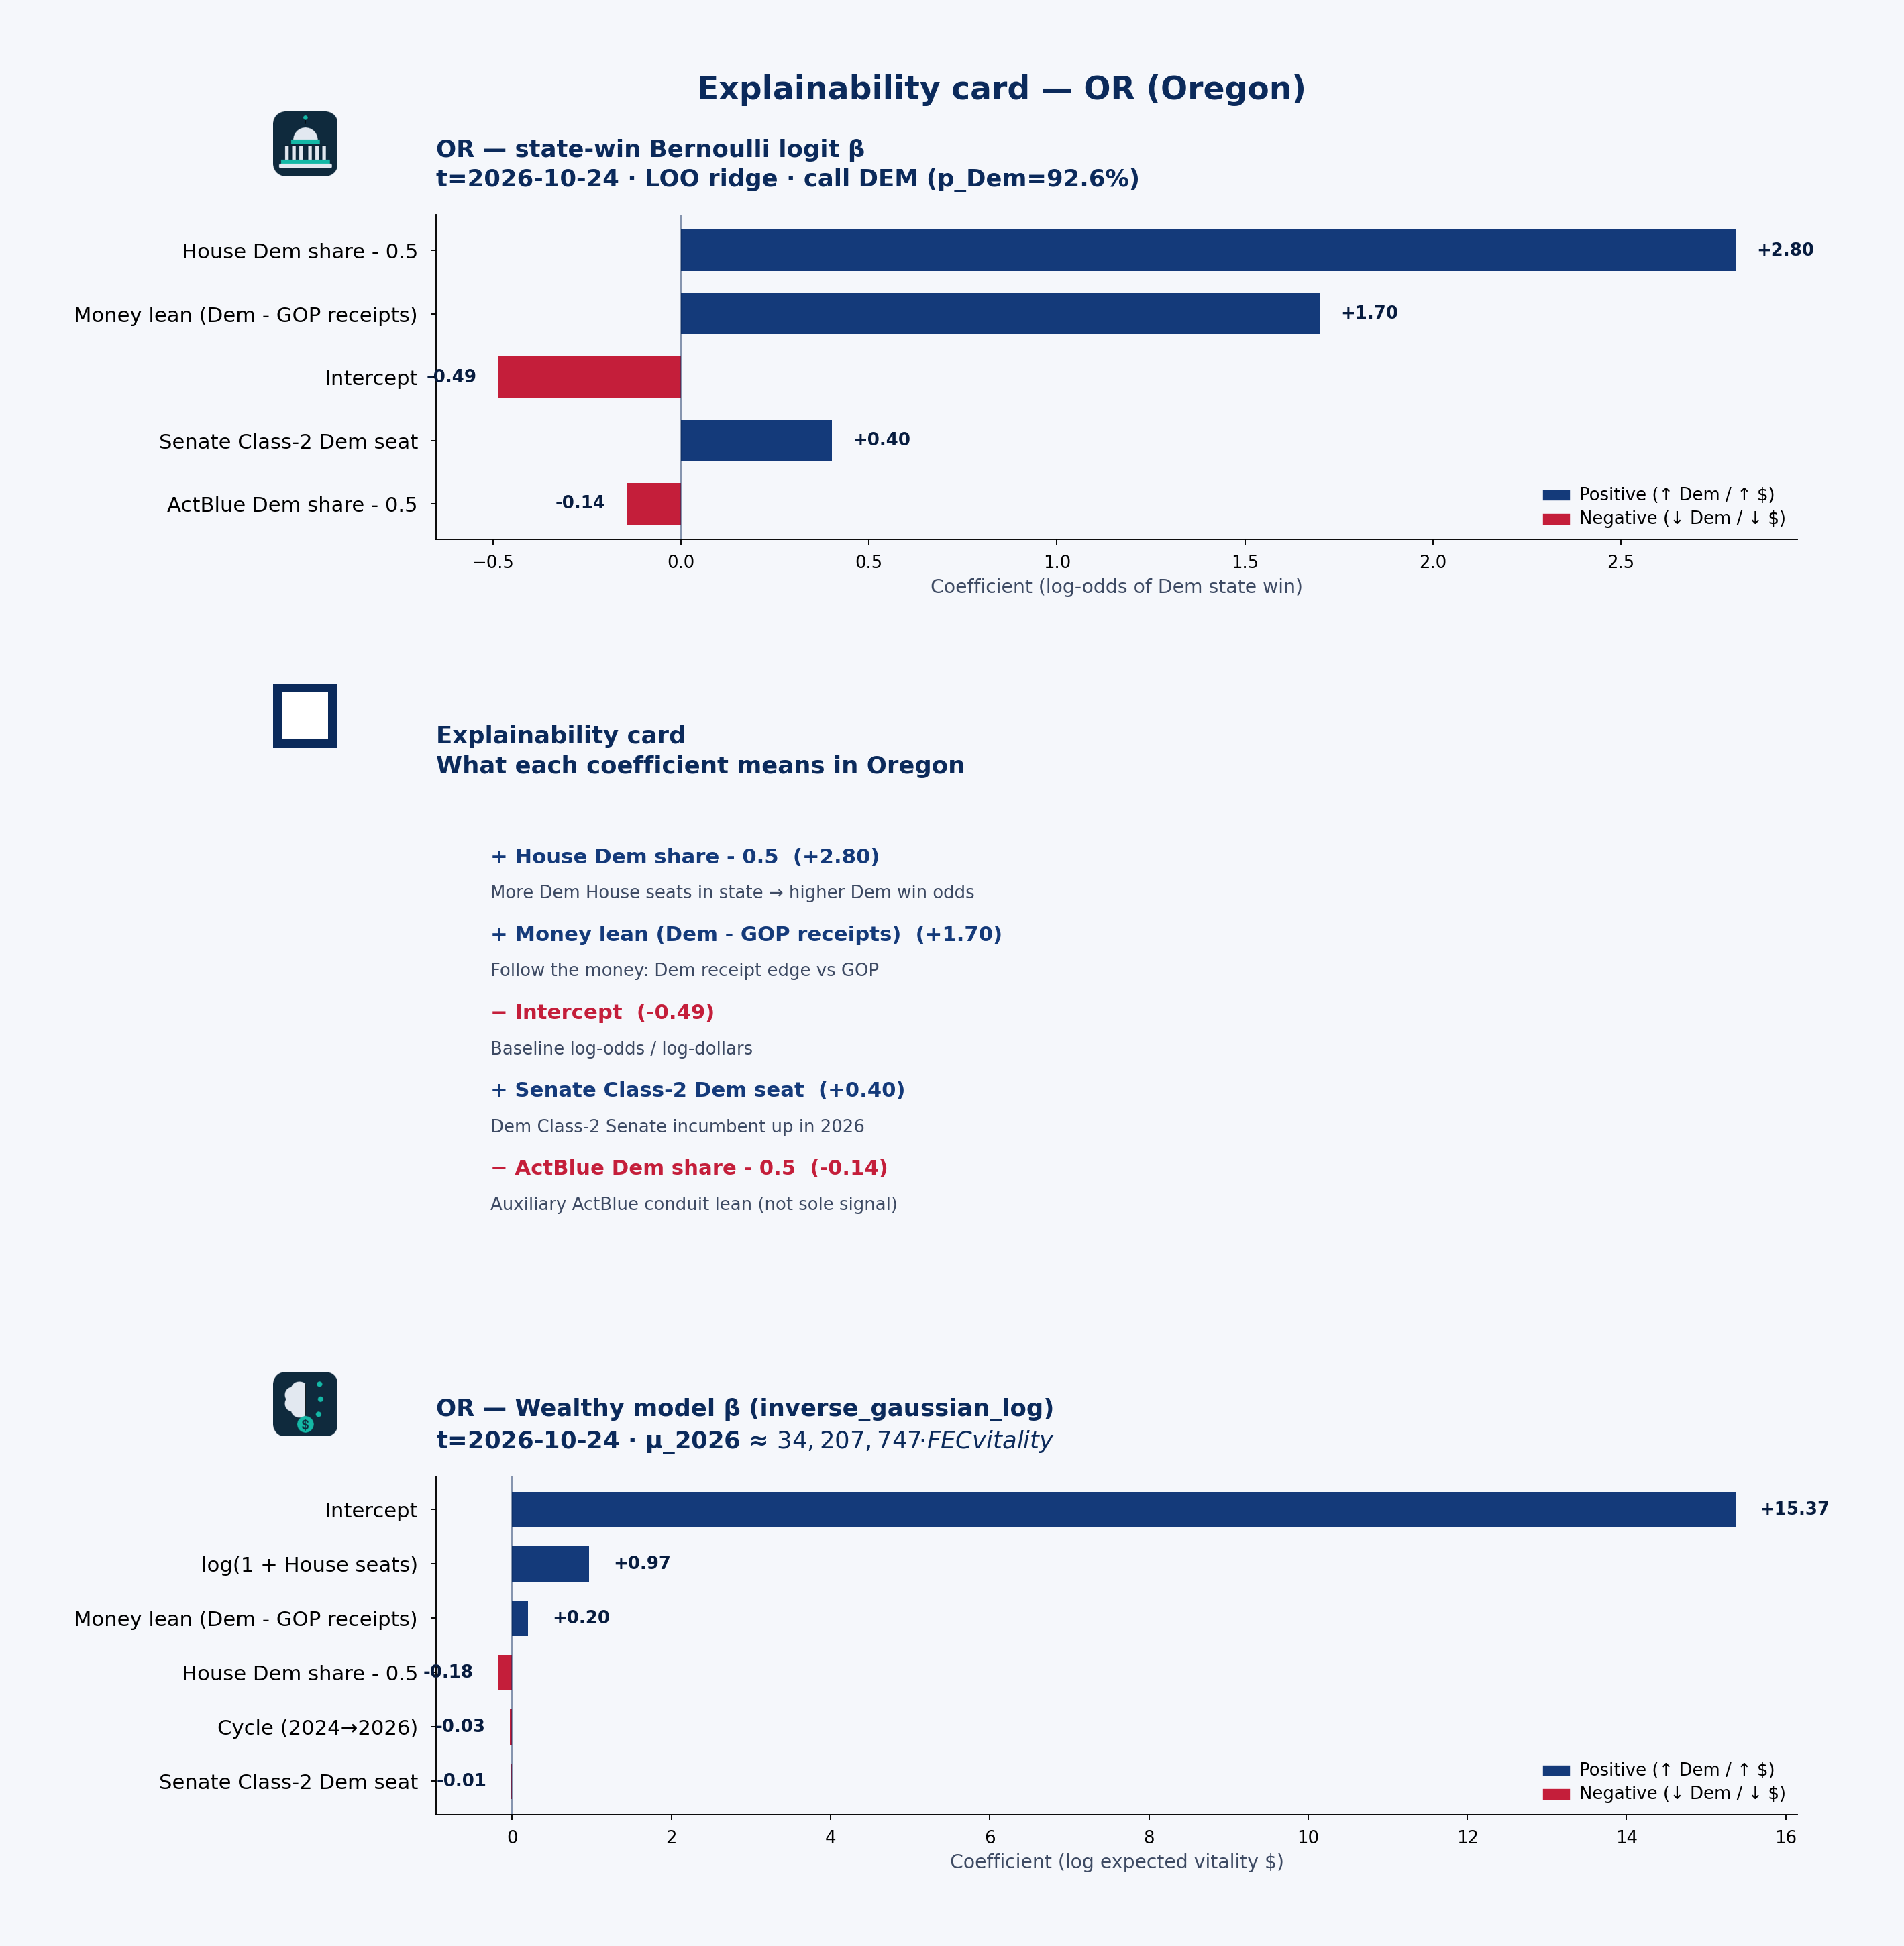 State explainability card · state-win LOO coefficient stability, plain language, and Wealthy model · OR · t=2026-10-24
Statewide call: DEM (p_Dem=93%) · 2026 money shape: balanced
Receipts by cycle (campaign-finance weball)
| Cycle | Candidate | Total receipts | Individual | PAC (other pol. cmte) |
|---|---|---|---|---|
| 2024 | BENTZ, CLIFF | $1.13M | $562k | $567k |
| 2026 | BENTZ, CLIFF | $1.34M | $602k | $735k |
| 2024 | BONAMICI, SUZANNE MS. | $937k | $409k | $527k |
| 2026 | BONAMICI, SUZANNE MS. | $1.03M | $492k | $531k |
| 2024 | BYNUM, JANELLE | $7.52M | $6.59M | $769k |
| 2026 | BYNUM, JANELLE | $4.74M | $2.87M | $1.38M |
| 2024 | DEXTER, MAXINE | $1.82M | $1.53M | $268k |
| 2026 | DEXTER, MAXINE | $1.30M | $830k | $454k |
| 2024 | HOYLE, VALERIE | $2.67M | $1.40M | $1.17M |
| 2026 | HOYLE, VALERIE | $1.65M | $861k | $786k |
| 2024 | MERKLEY, JEFFREY ALAN | $1.51M | $1.00M | $41k |
| 2026 | MERKLEY, JEFFREY ALAN | $5.38M | $4.13M | $578k |
| 2024 | SALINAS, ANDREA | $5.40M | $3.69M | $1.46M |
| 2026 | SALINAS, ANDREA | $1.98M | $1.15M | $809k |
| 2024 | WYDEN, RONALD L. | $1.53M | $666k | $309k |
| 2026 | WYDEN, RONALD L. | $1.92M | $1.11M | $372k |
PAC & individual money
PAC money was about $5.11M of $22.52M total receipts in 2024 and $5.64M of $19.34M in 2026. Direct committee→candidate 24K (non-memo) ran about $5.23M (2024) / $5.03M (2026). Itemized individual share from Oregon: 70.4% (2024) / 62.3% (2026).
BYNUM, JANELLE: Cycle-to-date weball receipts ~$4.74M, with PAC direct 24K $781k → $1.22M vs 2024. the public campaign-finance data feed by-size individual totals are not loaded in this 50-state snapshot.
Spotlight candidates
BYNUM, JANELLE
- In 2024, $6.59M of $7.52M came from individuals; PAC (other pol. cmte) $769k.
- In 2026, $2.87M of $4.74M came from individuals; PAC (other pol. cmte) $1.38M.
SALINAS, ANDREA
- In 2024, $3.69M of $5.40M came from individuals; PAC (other pol. cmte) $1.46M.
- In 2026, $1.15M of $1.98M came from individuals; PAC (other pol. cmte) $809k.
MERKLEY, JEFFREY ALAN
- In 2024, $1.00M of $1.51M came from individuals; PAC (other pol. cmte) $41k.
- In 2026, $4.13M of $5.38M came from individuals; PAC (other pol. cmte) $578k.
Short talking points — money & predicted voting
Open with the model set’s statewide call: DEM favored at about 93% Dem win probability on public campaign-finance + roster features — not a poll. Then the money shape: Oregon federal candidates look balanced in 2026 weball (about $5.64M PAC / $12.04M individual of $19.34M total). Spotlight BYNUM, JANELLE for one concrete receipt picture. Close civic: these are public contribution patterns and a transparent forecast model call — not evidence of wrongdoing, and not a substitute for Cook or election-night counts.
PA — Pennsylvania
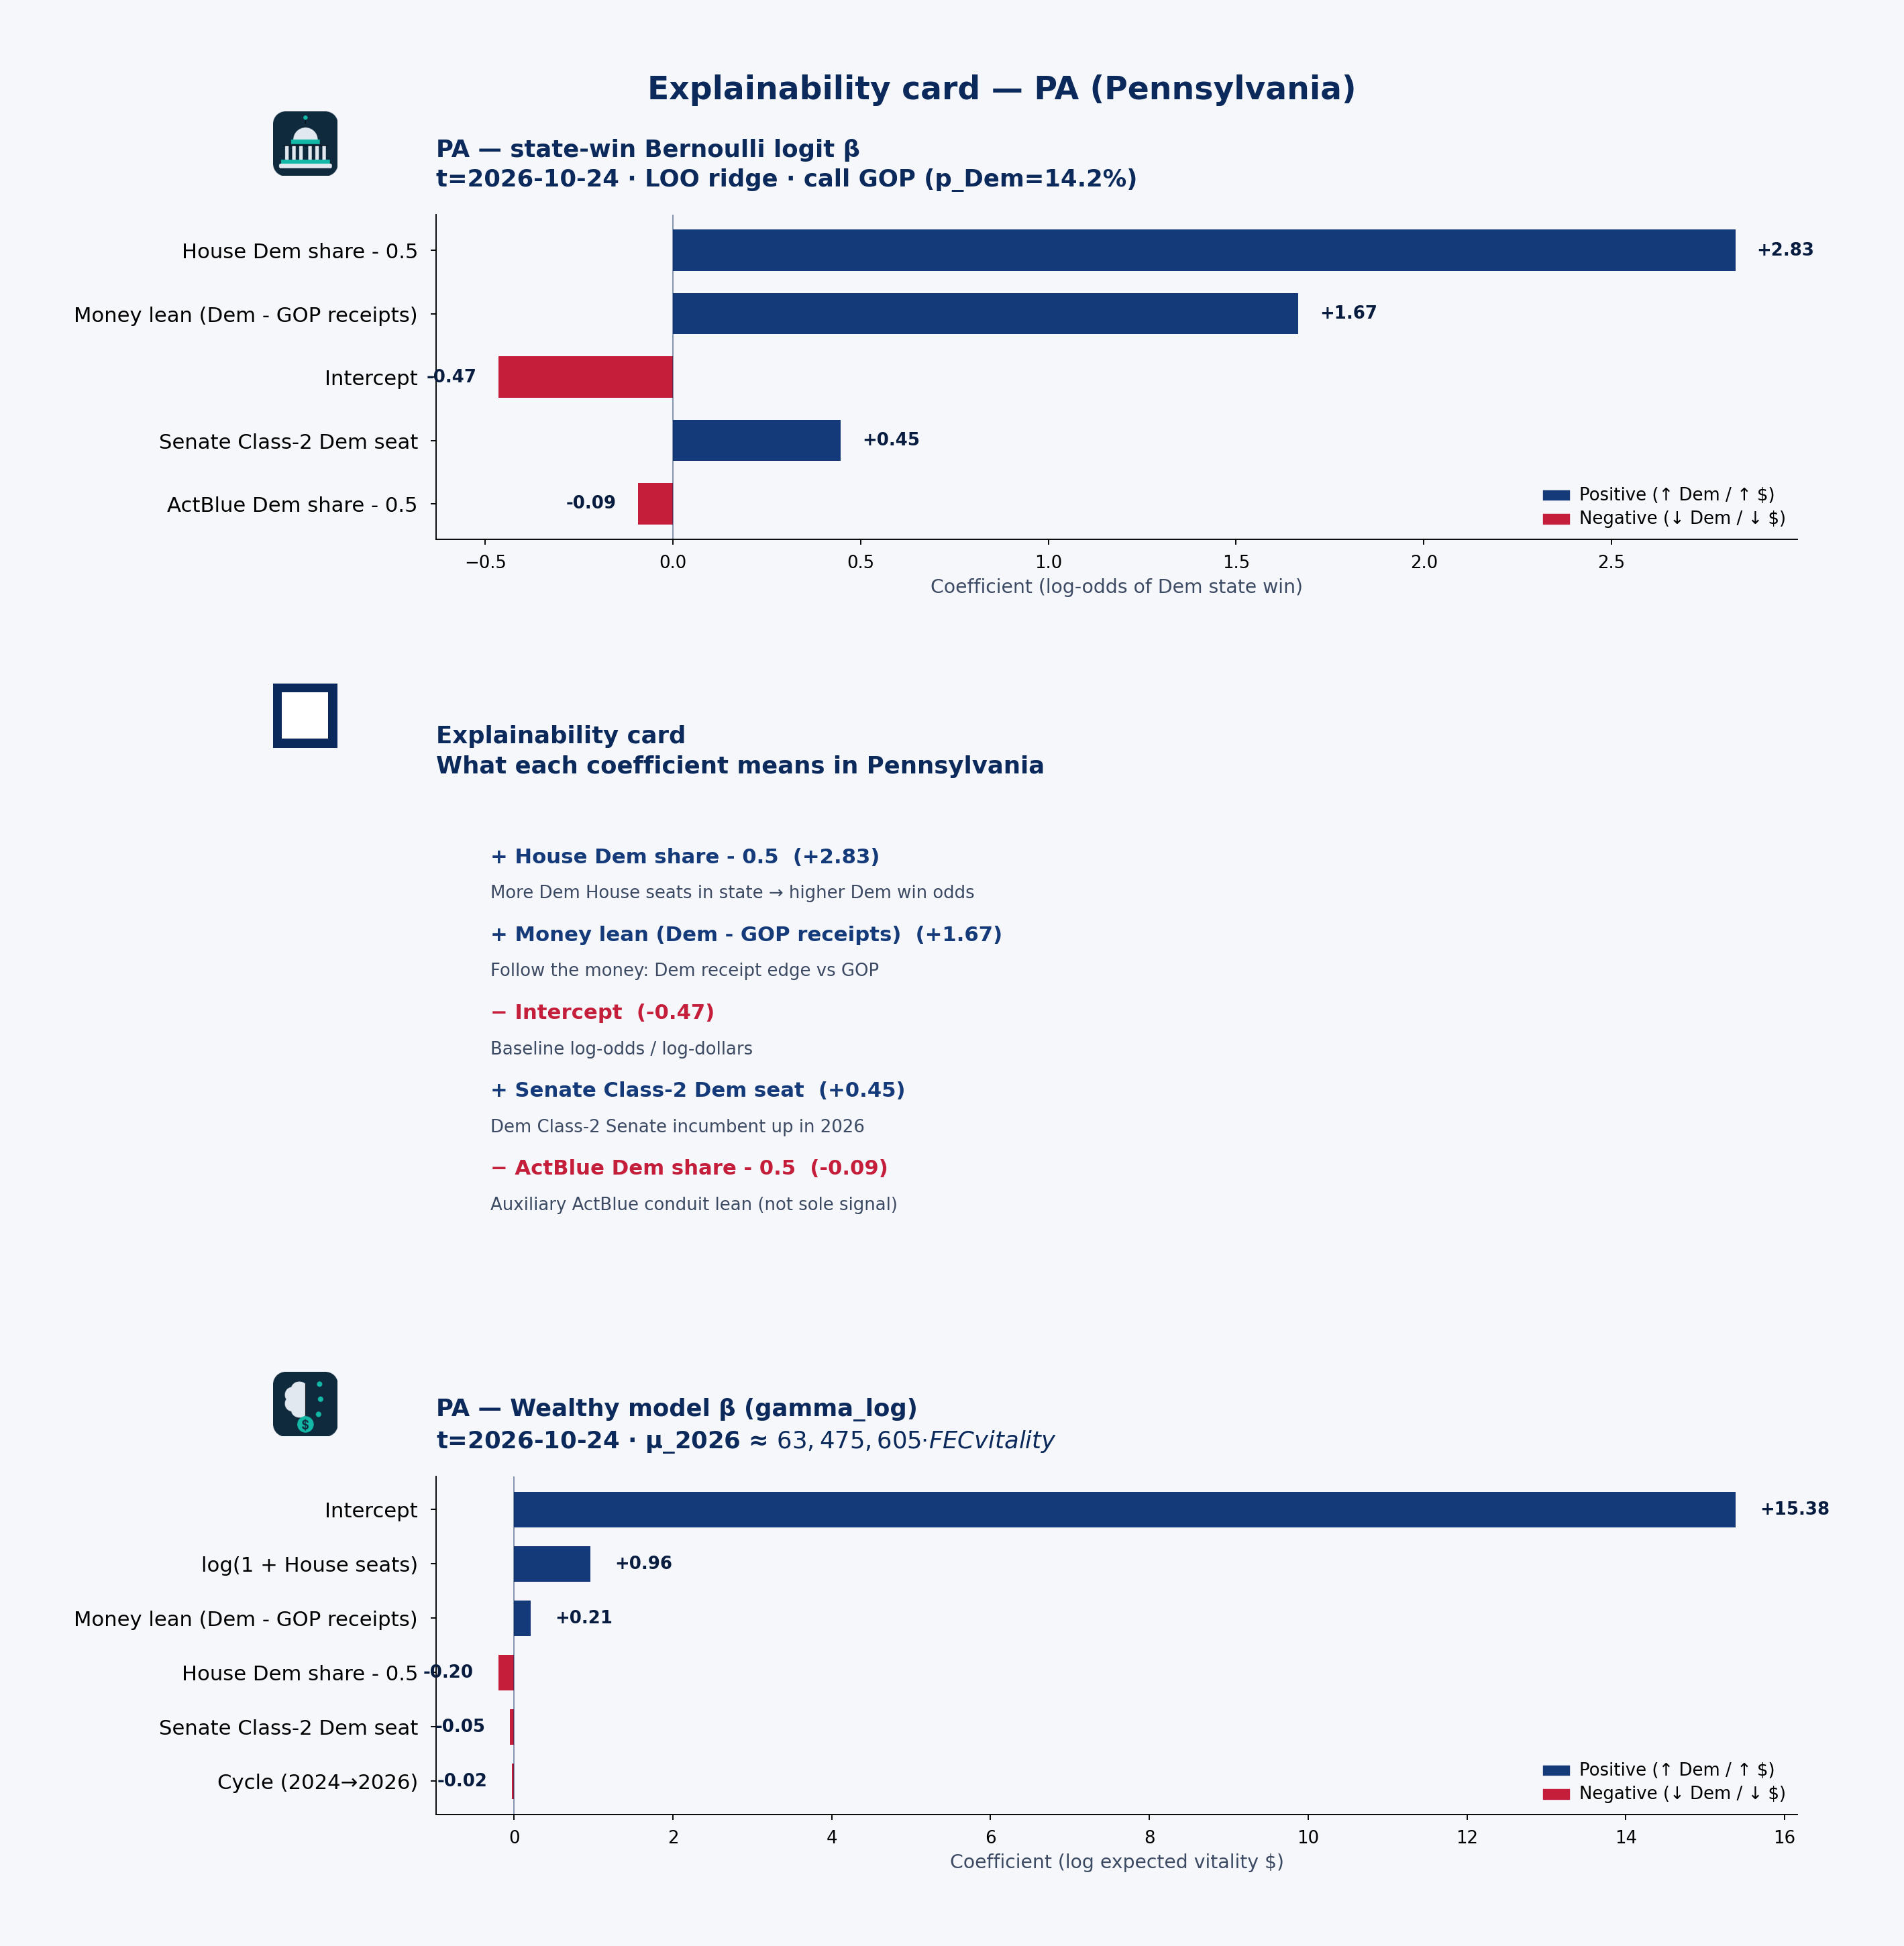 State explainability card · state-win LOO coefficient stability, plain language, and Wealthy model · PA · t=2026-10-24
Statewide call: GOP (p_Dem=14%) · 2026 money shape: balanced
Receipts by cycle (campaign-finance weball)
| Cycle | Candidate | Total receipts | Individual | PAC (other pol. cmte) |
|---|---|---|---|---|
| 2024 | CARTWRIGHT, MATTHEW A. | $8.65M | $5.89M | $1.88M |
| 2026 | CARTWRIGHT, MATTHEW A. | $468 | $0 | $0 |
| 2024 | CASEY, ROBERT P. JR. | $58.15M | $43.60M | $2.90M |
| 2026 | CASEY, ROBERT P. JR. | $764k | $0 | $0 |
| 2026 | COGNETTI, PAIGE | $7.50M | $6.30M | $658k |
| 2024 | FETTERMAN, JOHN KARL | $7.44M | $6.82M | $36k |
| 2026 | FETTERMAN, JOHN KARL | $2.96M | $2.28M | $40k |
| 2024 | FITZPATRICK, BRIAN | $6.44M | $2.29M | $2.64M |
| 2026 | FITZPATRICK, BRIAN | $8.02M | $1.91M | $2.68M |
| 2024 | MCCORMICK, DAVE | $35.97M | $21.18M | $1.01M |
| 2026 | MCCORMICK, DAVE | $6.70M | $3.61M | $780k |
| 2024 | STELSON, JANELLE | $6.52M | $5.38M | $624k |
| 2026 | STELSON, JANELLE | $9.23M | $7.35M | $727k |
| 2024 | WILD, SUSAN | $8.96M | $6.60M | $1.39M |
| 2026 | WILD, SUSAN | $8k | $0 | $0 |
PAC & individual money
PAC money was about $26.16M of $186.22M total receipts in 2024 and $22.01M of $104.24M in 2026. Direct committee→candidate 24K (non-memo) ran about $28.38M (2024) / $19.22M (2026). Itemized individual share from Pennsylvania: 65.7% (2024) / 59.1% (2026).
CASEY, ROBERT P. JR.: Cycle-to-date weball receipts ~$764k, with PAC direct 24K $3.19M → $0 vs 2024. the public campaign-finance data feed by-size individual totals are not loaded in this 50-state snapshot.
Spotlight candidates
CASEY, ROBERT P. JR.
- In 2024, $43.60M of $58.15M came from individuals; PAC (other pol. cmte) $2.90M.
- In 2026, $0 of $764k came from individuals; PAC (other pol. cmte) $0.
MCCORMICK, DAVE
- In 2024, $21.18M of $35.97M came from individuals; PAC (other pol. cmte) $1.01M.
- In 2026, $3.61M of $6.70M came from individuals; PAC (other pol. cmte) $780k.
STELSON, JANELLE
- In 2024, $5.38M of $6.52M came from individuals; PAC (other pol. cmte) $624k.
- In 2026, $7.35M of $9.23M came from individuals; PAC (other pol. cmte) $727k.
Short talking points — money & predicted voting
Open with the model set’s statewide call: GOP favored at about 14% Dem win probability on public campaign-finance + roster features — not a poll. Then the money shape: Pennsylvania federal candidates look balanced in 2026 weball (about $22.01M PAC / $61.62M individual of $104.24M total). Spotlight CASEY, ROBERT P. JR. for one concrete receipt picture. Close civic: these are public contribution patterns and a transparent forecast model call — not evidence of wrongdoing, and not a substitute for Cook or election-night counts.
RI — Rhode Island
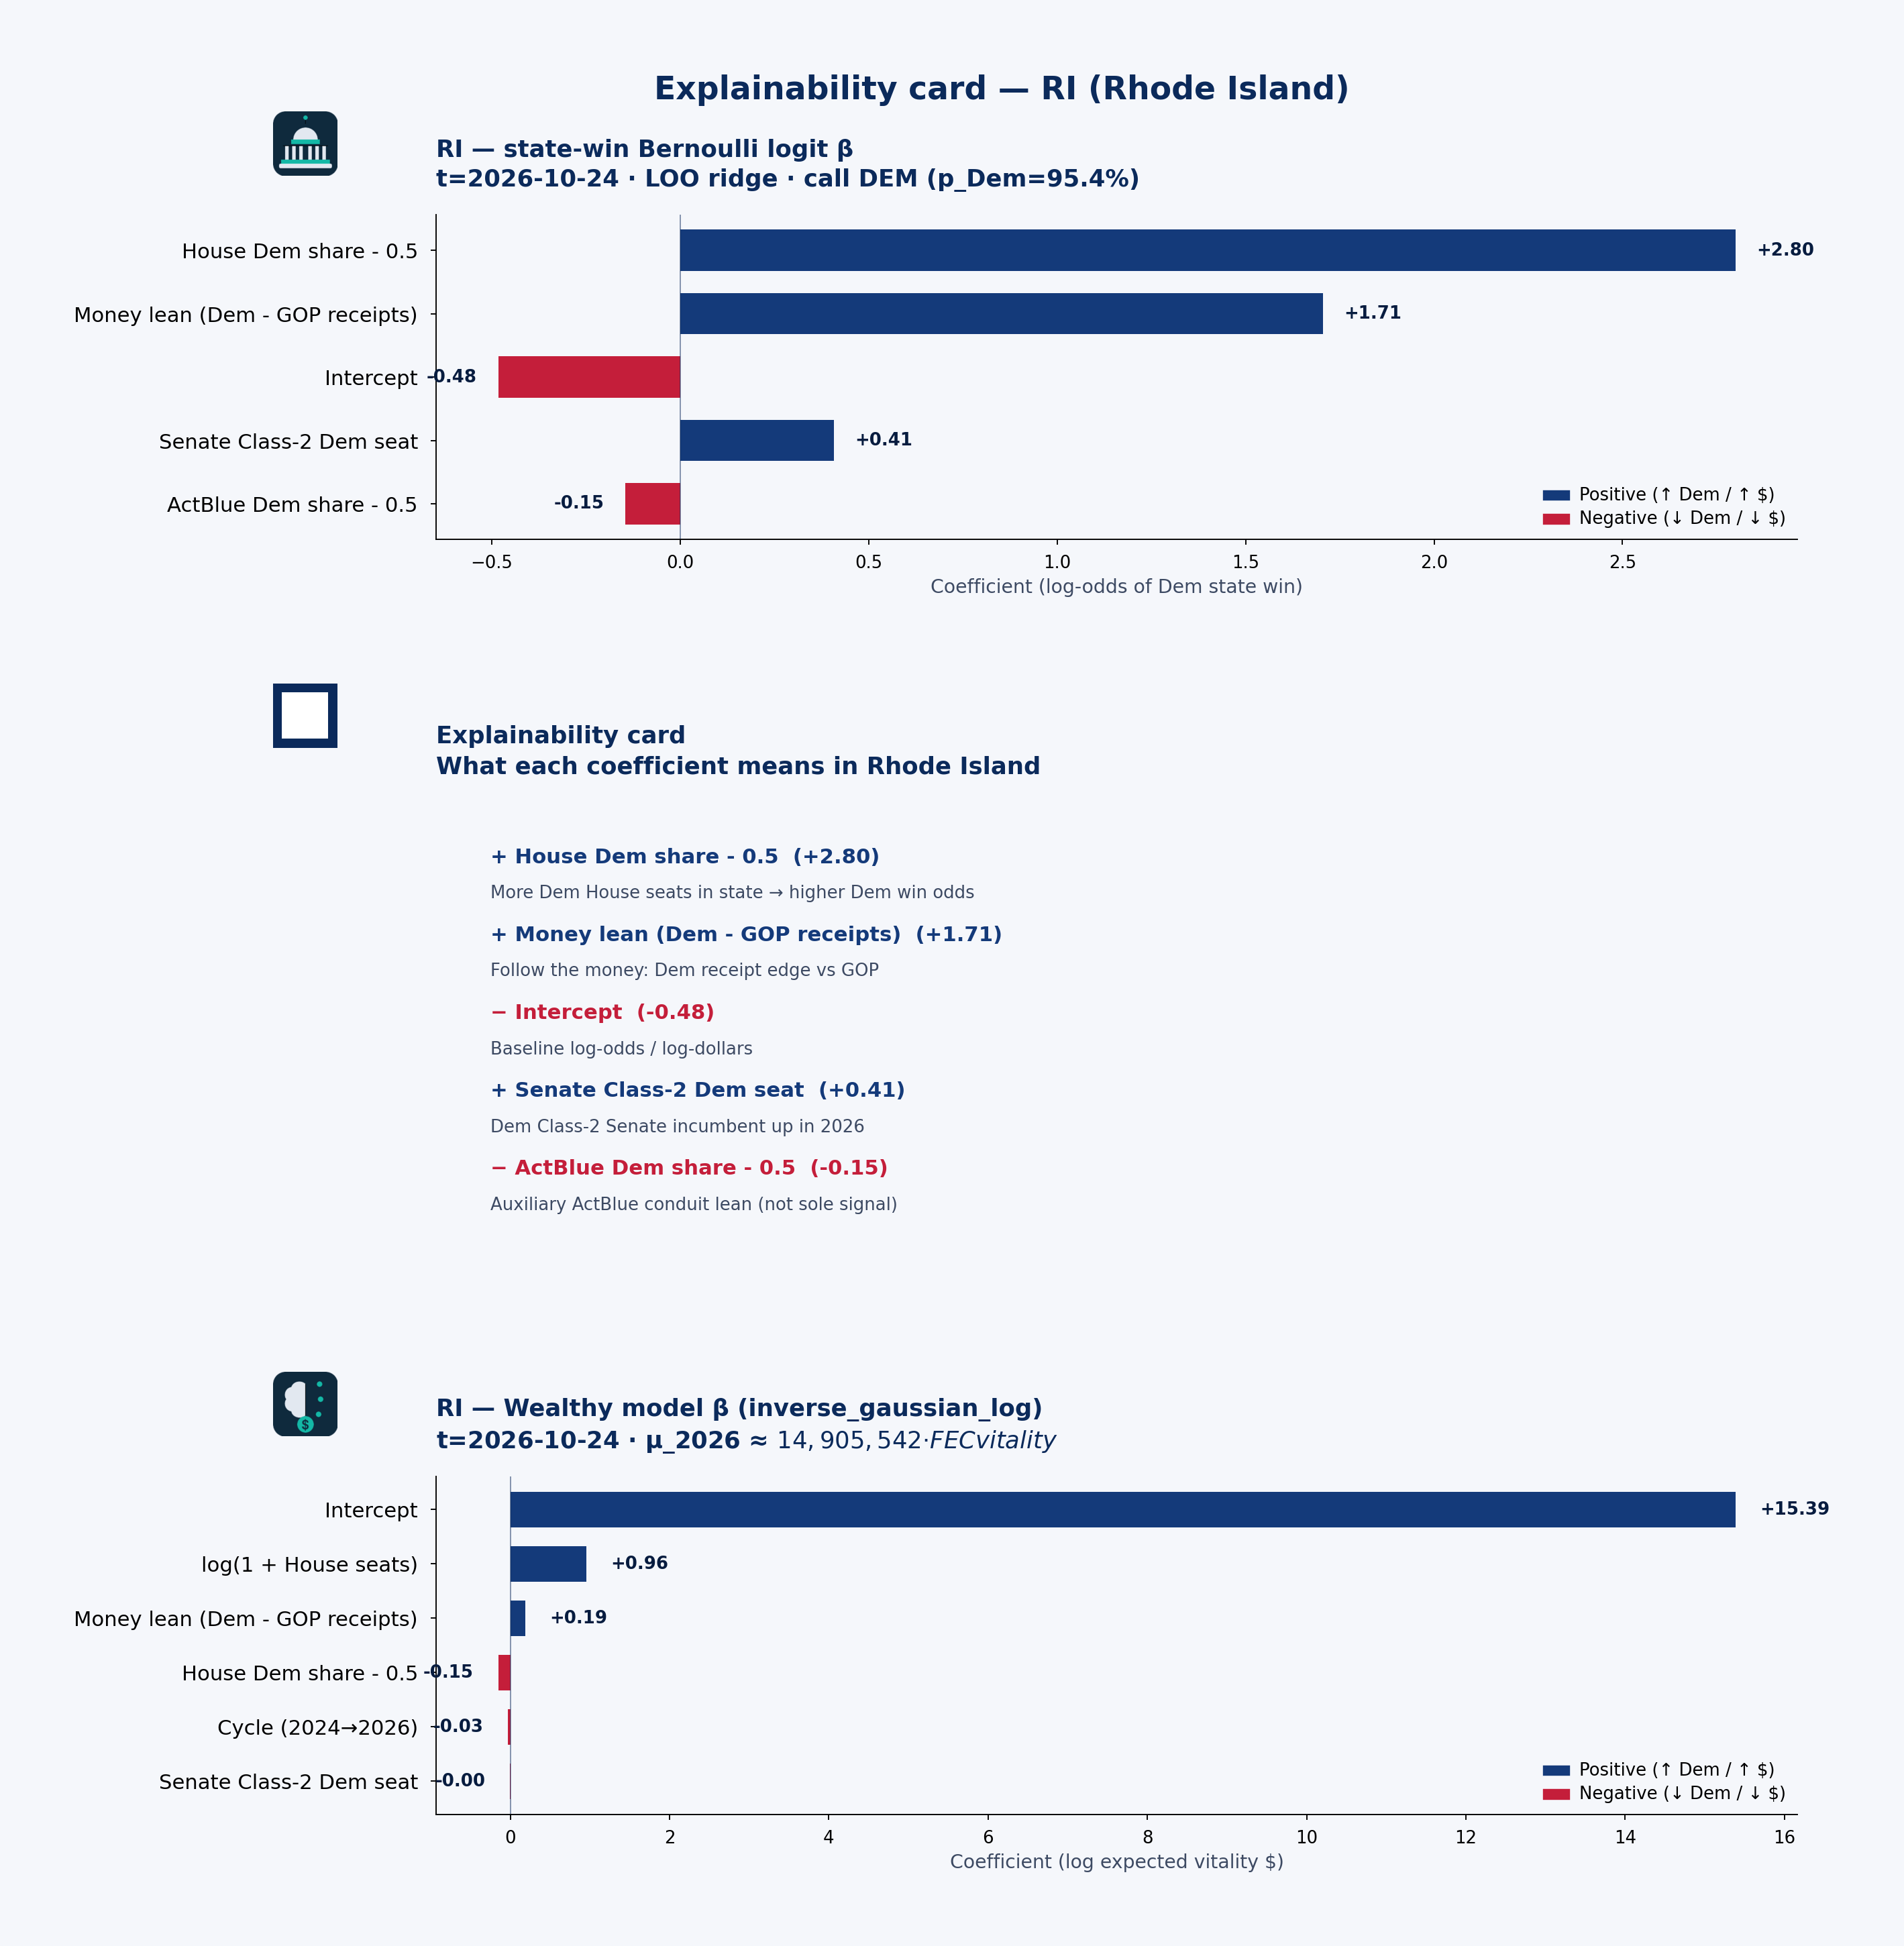 State explainability card · state-win LOO coefficient stability, plain language, and Wealthy model · RI · t=2026-10-24
Statewide call: DEM (p_Dem=95%) · 2026 money shape: balanced
Receipts by cycle (campaign-finance weball)
| Cycle | Candidate | Total receipts | Individual | PAC (other pol. cmte) |
|---|---|---|---|---|
| 2024 | AMO, GABRIEL F | $2.58M | $1.90M | $676k |
| 2026 | AMO, GABRIEL F | $1.95M | $1.16M | $772k |
| 2024 | MAGAZINER, SETH | $2.04M | $1.17M | $748k |
| 2026 | MAGAZINER, SETH | $1.61M | $898k | $619k |
| 2024 | REED, JOHN F. | $566k | $329k | $164k |
| 2026 | REED, JOHN F. | $3.73M | $2.28M | $1.33M |
| 2024 | WHITEHOUSE, SHELDON | $4.86M | $2.70M | $738k |
| 2026 | WHITEHOUSE, SHELDON | $653k | $505k | $60k |
PAC & individual money
PAC money was about $2.33M of $10.04M total receipts in 2024 and $2.78M of $7.95M in 2026. Direct committee→candidate 24K (non-memo) ran about $2.35M (2024) / $2.51M (2026). Itemized individual share from Rhode Island: 60.7% (2024) / 60.9% (2026).
WHITEHOUSE, SHELDON: Cycle-to-date weball receipts ~$653k, with PAC direct 24K $767k → $66k vs 2024. the public campaign-finance data feed by-size individual totals are not loaded in this 50-state snapshot.
Spotlight candidates
WHITEHOUSE, SHELDON
- In 2024, $2.70M of $4.86M came from individuals; PAC (other pol. cmte) $738k.
- In 2026, $505k of $653k came from individuals; PAC (other pol. cmte) $60k.
REED, JOHN F.
- In 2024, $329k of $566k came from individuals; PAC (other pol. cmte) $164k.
- In 2026, $2.28M of $3.73M came from individuals; PAC (other pol. cmte) $1.33M.
AMO, GABRIEL F
- In 2024, $1.90M of $2.58M came from individuals; PAC (other pol. cmte) $676k.
- In 2026, $1.16M of $1.95M came from individuals; PAC (other pol. cmte) $772k.
Short talking points — money & predicted voting
Open with the model set’s statewide call: DEM favored at about 95% Dem win probability on public campaign-finance + roster features — not a poll. Then the money shape: Rhode Island federal candidates look balanced in 2026 weball (about $2.78M PAC / $4.84M individual of $7.95M total). Spotlight WHITEHOUSE, SHELDON for one concrete receipt picture. Close civic: these are public contribution patterns and a transparent forecast model call — not evidence of wrongdoing, and not a substitute for Cook or election-night counts.
SC — South Carolina
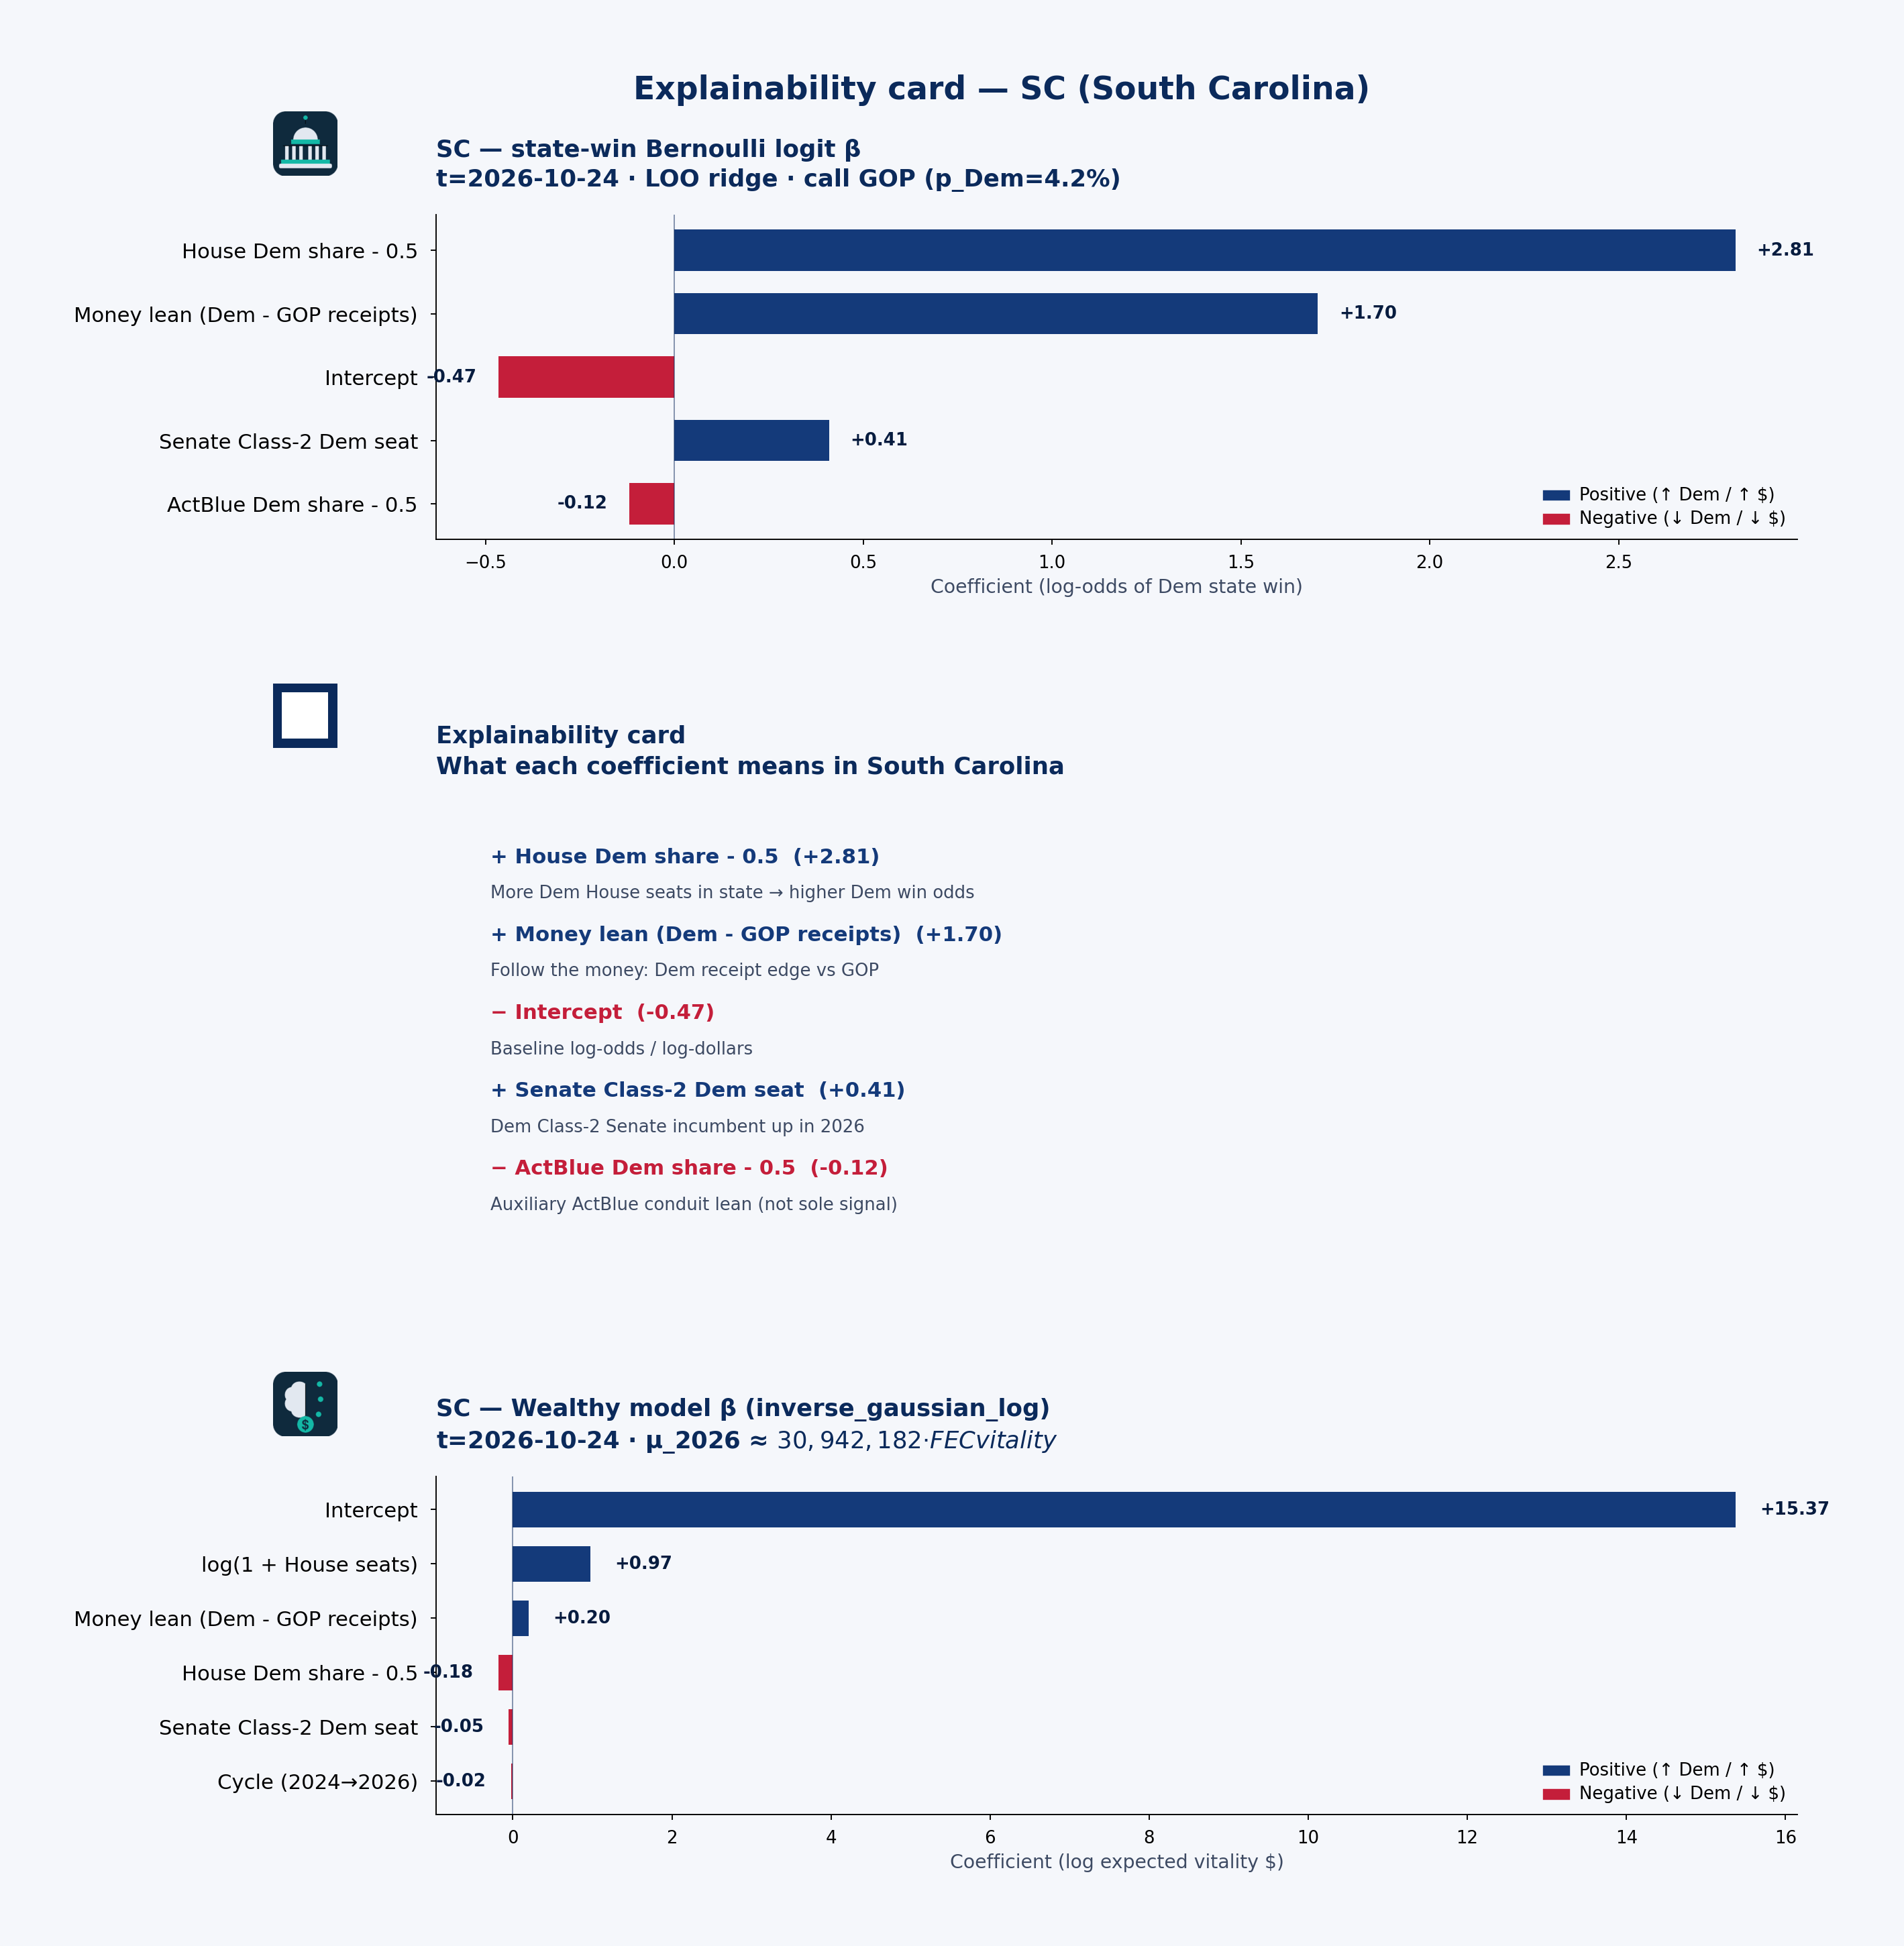 State explainability card · state-win LOO coefficient stability, plain language, and Wealthy model · SC · t=2026-10-24
Statewide call: GOP (p_Dem=4%) · 2026 money shape: balanced
Receipts by cycle (campaign-finance weball)
| Cycle | Candidate | Total receipts | Individual | PAC (other pol. cmte) |
|---|---|---|---|---|
| 2024 | BIGGS, SHERI | $1.08M | $403k | $278k |
| 2026 | BIGGS, SHERI | $707k | $117k | $360k |
| 2026 | CLYBURN, JAMES E | $1.69M | $674k | $961k |
| 2024 | CLYBURN, JAMES E. | $2.22M | $736k | $1.47M |
| 2026 | FRY, RUSSELL | $1.50M | $1.14M | $102k |
| 2024 | MACE, NANCY | $3.48M | $1.18M | $594k |
| 2026 | MACE, NANCY | $453k | $171k | $12k |
| 2026 | NORMAN, RALPH | $3.18M | $950k | $58k |
| 2024 | SCOTT, TIMOTHY E. | $18.86M | $16.18M | $730k |
| 2026 | SCOTT, TIMOTHY E. | $6.68M | $5.69M | $242k |
| 2024 | TIMMONS, WILLIAM R IV | $2.31M | $344k | $997k |
| 2026 | TIMMONS, WILLIAM R IV | $1.77M | $327k | $778k |
| 2024 | WILSON, JOE THE HON. | $881k | $467k | $397k |
| 2026 | WILSON, JOE THE HON. | $1.02M | $429k | $360k |
PAC & individual money
PAC money was about $4.46M of $28.83M total receipts in 2024 and $2.87M of $17.00M in 2026. Direct committee→candidate 24K (non-memo) ran about $4.72M (2024) / $2.56M (2026). Itemized individual share from South Carolina: 67.0% (2024) / 55.9% (2026).
SCOTT, TIMOTHY E.: Cycle-to-date weball receipts ~$6.68M, with PAC direct 24K $930k → $230k vs 2024. the public campaign-finance data feed by-size individual totals are not loaded in this 50-state snapshot.
Spotlight candidates
SCOTT, TIMOTHY E.
- In 2024, $16.18M of $18.86M came from individuals; PAC (other pol. cmte) $730k.
- In 2026, $5.69M of $6.68M came from individuals; PAC (other pol. cmte) $242k.
MACE, NANCY
- In 2024, $1.18M of $3.48M came from individuals; PAC (other pol. cmte) $594k.
- In 2026, $171k of $453k came from individuals; PAC (other pol. cmte) $12k.
NORMAN, RALPH
- In 2026, $950k of $3.18M came from individuals; PAC (other pol. cmte) $58k.
Short talking points — money & predicted voting
Open with the model set’s statewide call: GOP favored at about 4% Dem win probability on public campaign-finance + roster features — not a poll. Then the money shape: South Carolina federal candidates look balanced in 2026 weball (about $2.87M PAC / $9.51M individual of $17.00M total). Spotlight SCOTT, TIMOTHY E. for one concrete receipt picture. Close civic: these are public contribution patterns and a transparent forecast model call — not evidence of wrongdoing, and not a substitute for Cook or election-night counts.
SD — South Dakota
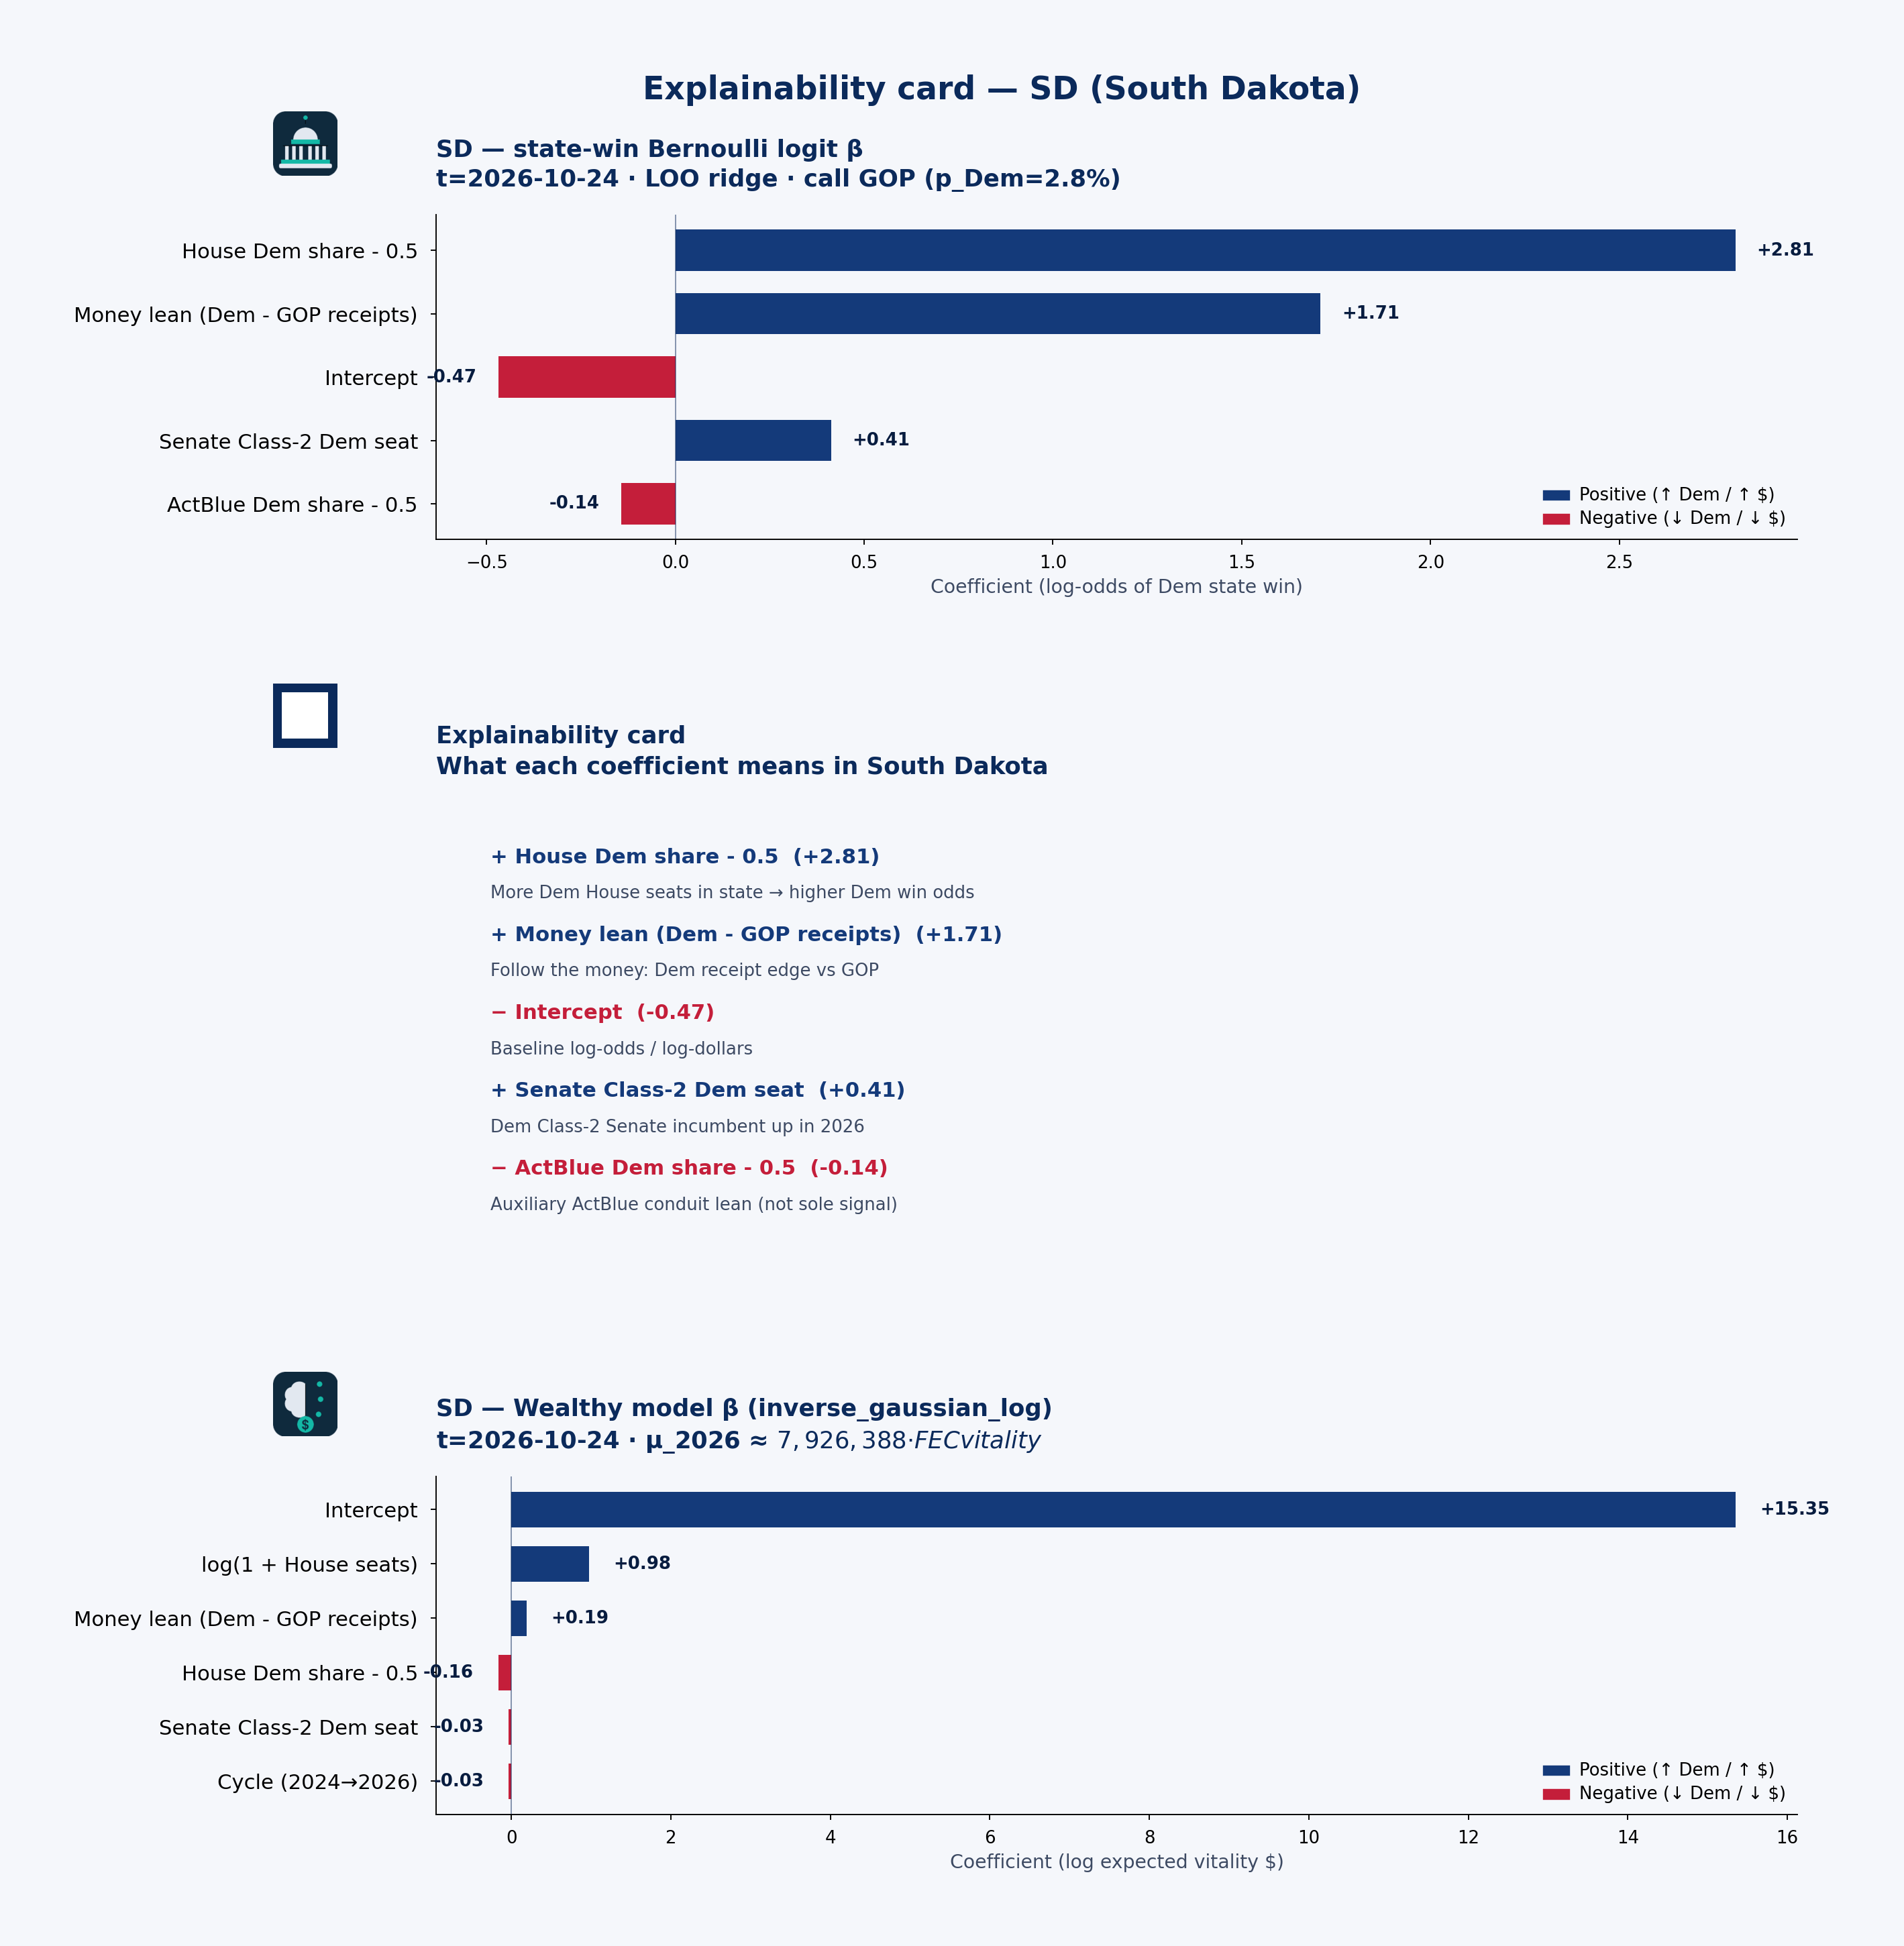 State explainability card · state-win LOO coefficient stability, plain language, and Wealthy model · SD · t=2026-10-24
Statewide call: GOP (p_Dem=3%) · 2026 money shape: balanced
Receipts by cycle (campaign-finance weball)
| Cycle | Candidate | Total receipts | Individual | PAC (other pol. cmte) |
|---|---|---|---|---|
| 2024 | JOHNSON, DUSTY | $4.38M | $2.37M | $1.31M |
| 2026 | JOHNSON, DUSTY | $1.71M | $813k | $322k |
| 2024 | ROUNDS, MIKE | $1.08M | $342k | $535k |
| 2026 | ROUNDS, MIKE | $3.81M | $1.59M | $1.63M |
| 2024 | THUNE, JOHN R. | $4.16M | $1.34M | $556k |
| 2026 | THUNE, JOHN R. | $4.68M | $1.53M | $849k |
PAC & individual money
PAC money was about $2.40M of $9.63M total receipts in 2024 and $2.81M of $10.20M in 2026. Direct committee→candidate 24K (non-memo) ran about $2.47M (2024) / $2.98M (2026). Itemized individual share from South Dakota: 42.1% (2024) / 38.5% (2026).
THUNE, JOHN R.: Cycle-to-date weball receipts ~$4.68M, with PAC direct 24K $659k → $870k vs 2024. the public campaign-finance data feed by-size individual totals are not loaded in this 50-state snapshot.
Spotlight candidates
THUNE, JOHN R.
- In 2024, $1.34M of $4.16M came from individuals; PAC (other pol. cmte) $556k.
- In 2026, $1.53M of $4.68M came from individuals; PAC (other pol. cmte) $849k.
JOHNSON, DUSTY
- In 2024, $2.37M of $4.38M came from individuals; PAC (other pol. cmte) $1.31M.
- In 2026, $813k of $1.71M came from individuals; PAC (other pol. cmte) $322k.
ROUNDS, MIKE
- In 2024, $342k of $1.08M came from individuals; PAC (other pol. cmte) $535k.
- In 2026, $1.59M of $3.81M came from individuals; PAC (other pol. cmte) $1.63M.
Short talking points — money & predicted voting
Open with the model set’s statewide call: GOP favored at about 3% Dem win probability on public campaign-finance + roster features — not a poll. Then the money shape: South Dakota federal candidates look balanced in 2026 weball (about $2.81M PAC / $3.93M individual of $10.20M total). Spotlight THUNE, JOHN R. for one concrete receipt picture. Close civic: these are public contribution patterns and a transparent forecast model call — not evidence of wrongdoing, and not a substitute for Cook or election-night counts.
TN — Tennessee
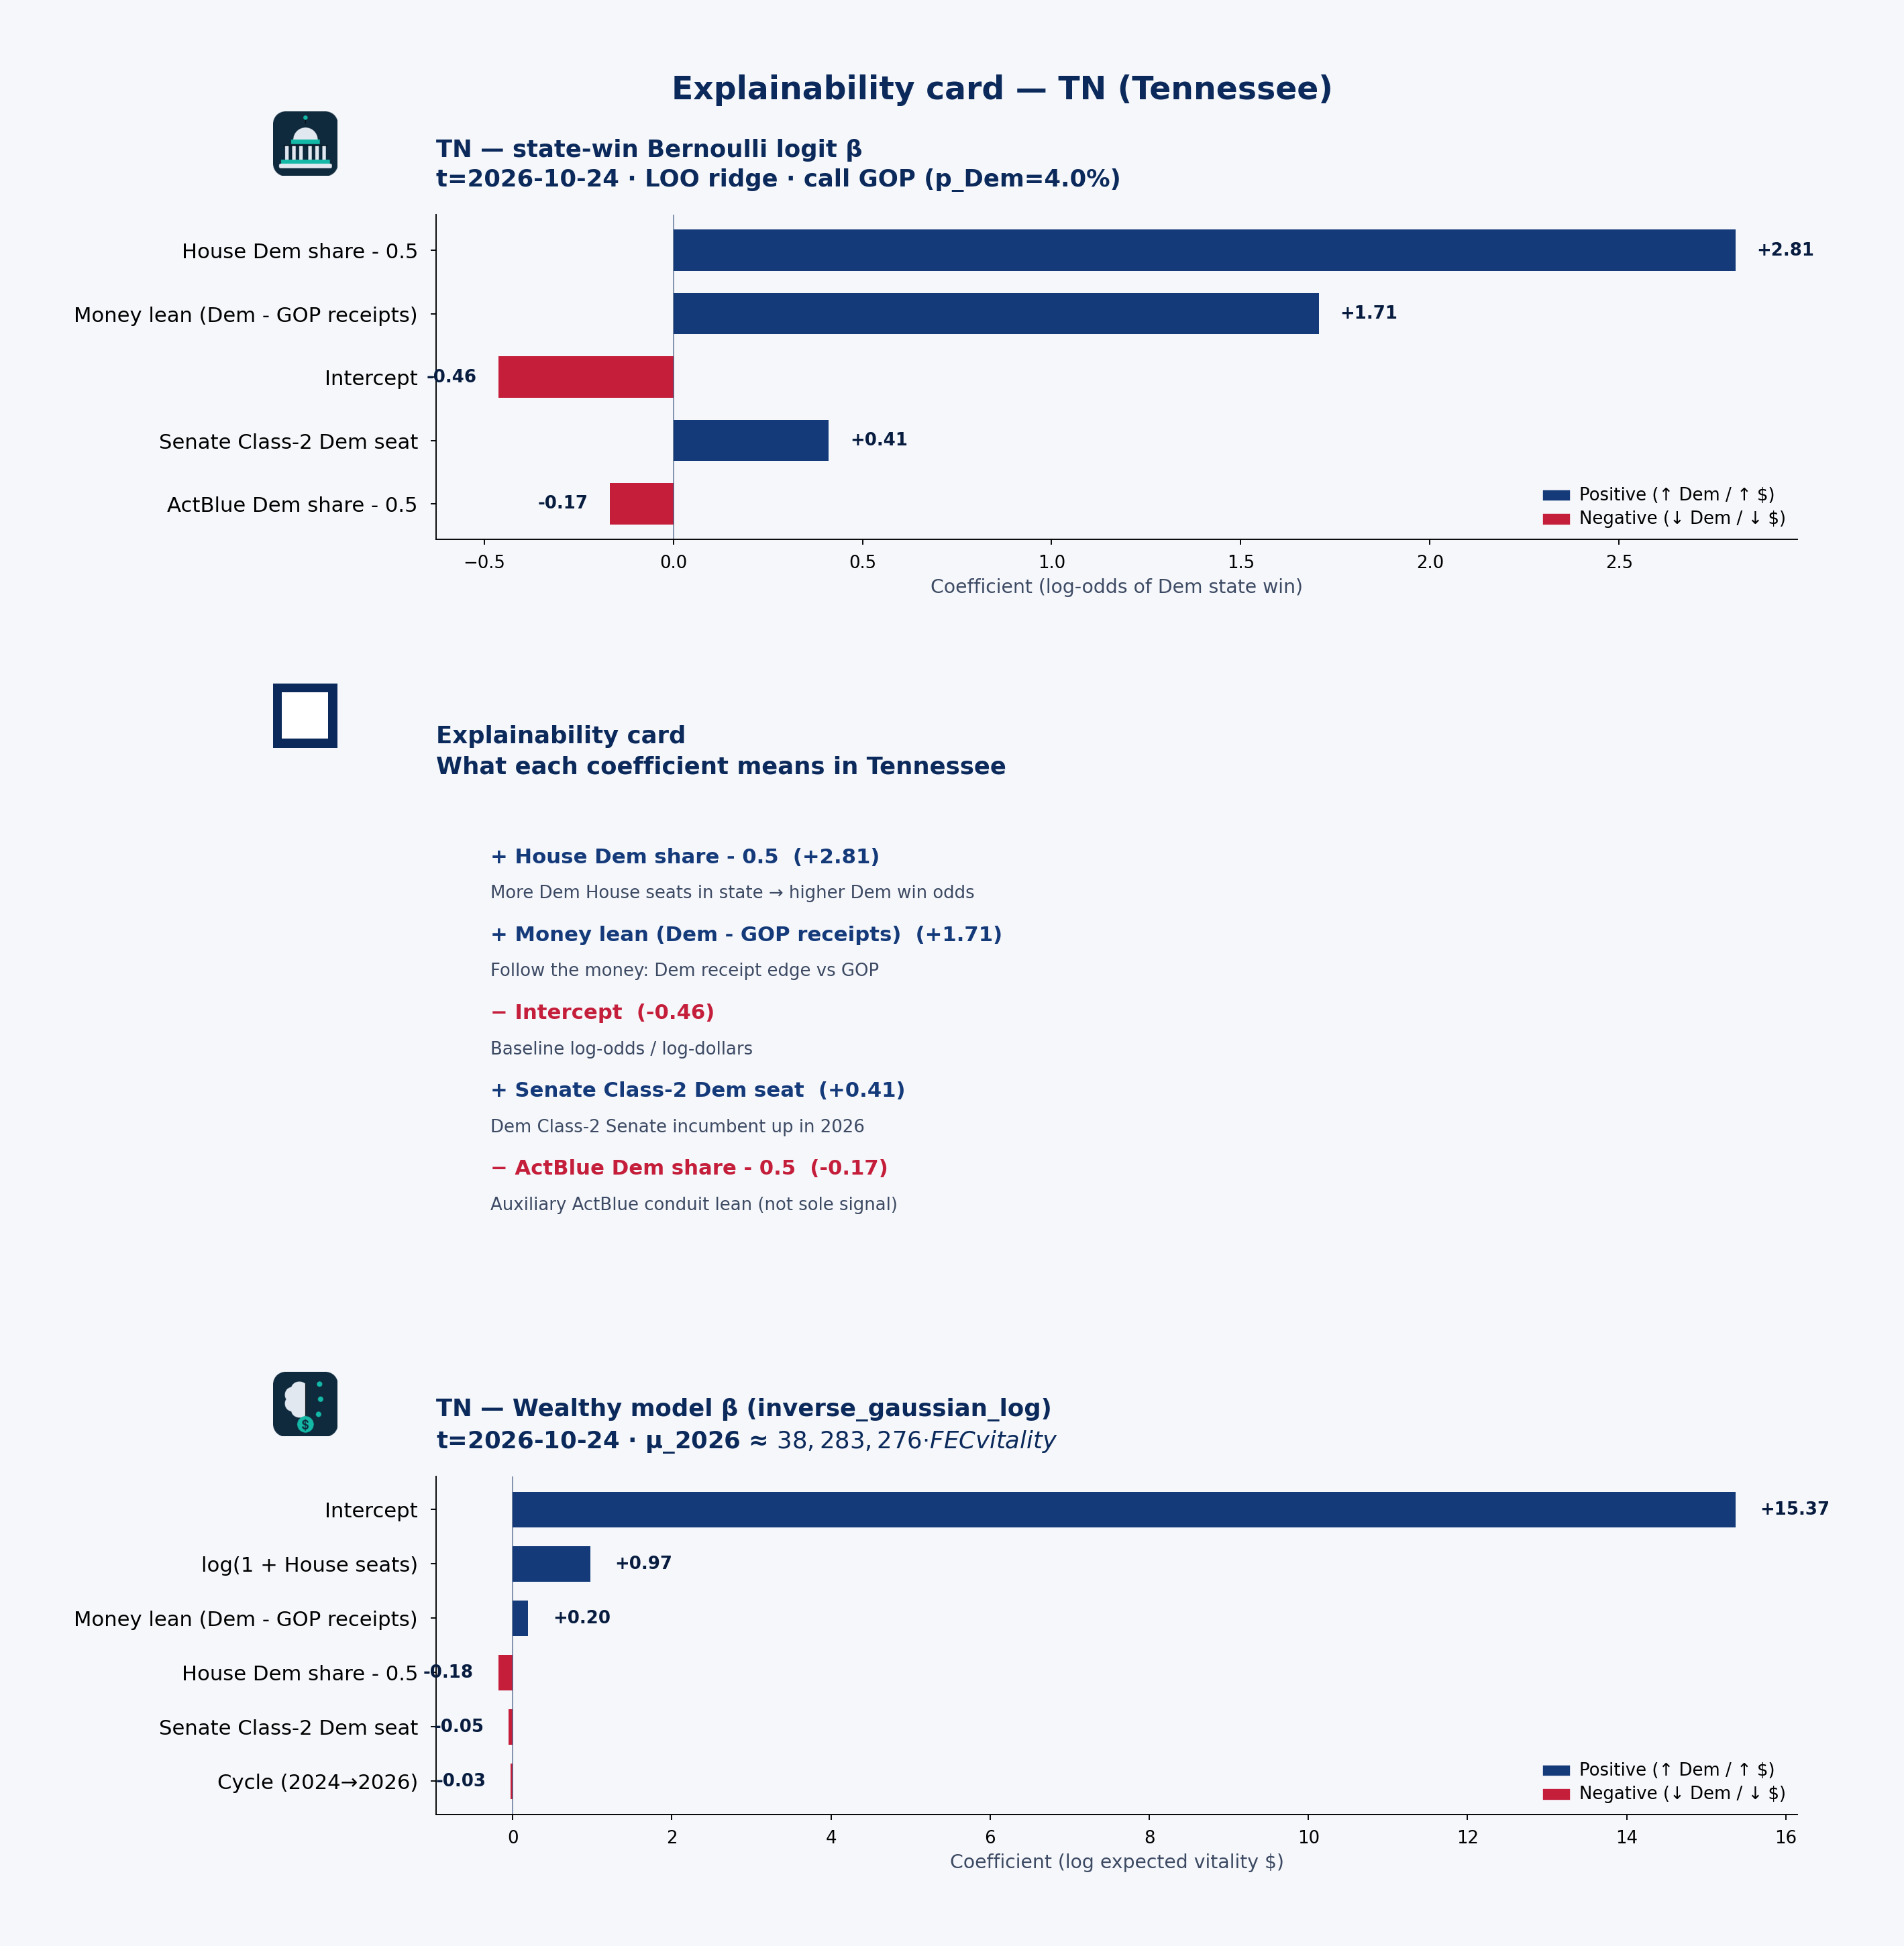 State explainability card · state-win LOO coefficient stability, plain language, and Wealthy model · TN · t=2026-10-24
Statewide call: GOP (p_Dem=4%) · 2026 money shape: balanced
Receipts by cycle (campaign-finance weball)
| Cycle | Candidate | Total receipts | Individual | PAC (other pol. cmte) |
|---|---|---|---|---|
| 2024 | BLACKBURN, MARSHA MRS. | $13.57M | $3.87M | $2.14M |
| 2026 | BLACKBURN, MARSHA MRS. | $3.22M | $255k | $132k |
| 2024 | BURCHETT, TIM | $1.24M | $1.07M | $139k |
| 2026 | BURCHETT, TIM | $3.13M | $2.83M | $260k |
| 2024 | FLEISCHMANN, CHARLES J | $1.90M | $1.03M | $311k |
| 2026 | FLEISCHMANN, CHARLES J | $2.73M | $1.70M | $145k |
| 2024 | HAGERTY, BILL | $4.91M | $3.32M | $806k |
| 2026 | HAGERTY, BILL | $8.42M | $4.40M | $1.77M |
| 2024 | HARSHBARGER, DIANA | $1.93M | $889k | $986k |
| 2026 | HARSHBARGER, DIANA | $1.54M | $569k | $838k |
| 2024 | KUSTOFF, DAVID | $2.50M | $1.06M | $1.12M |
| 2026 | KUSTOFF, DAVID | $2.59M | $1.22M | $1.17M |
| 2024 | ROSE, JOHN W. | $1.86M | $1.29M | $311k |
| 2026 | ROSE, JOHN W. | $78k | $48k | $18k |
| 2026 | VAN EPPS, MATTHEW ROBERT | $2.65M | $1.86M | $691k |
PAC & individual money
PAC money was about $6.75M of $29.90M total receipts in 2024 and $5.94M of $26.59M in 2026. Direct committee→candidate 24K (non-memo) ran about $7.43M (2024) / $6.10M (2026). Itemized individual share from Tennessee: 45.1% (2024) / 52.9% (2026).
BLACKBURN, MARSHA MRS.: Cycle-to-date weball receipts ~$3.22M, with PAC direct 24K $2.29M → $148k vs 2024. the public campaign-finance data feed by-size individual totals are not loaded in this 50-state snapshot.
Spotlight candidates
BLACKBURN, MARSHA MRS.
- In 2024, $3.87M of $13.57M came from individuals; PAC (other pol. cmte) $2.14M.
- In 2026, $255k of $3.22M came from individuals; PAC (other pol. cmte) $132k.
HAGERTY, BILL
- In 2024, $3.32M of $4.91M came from individuals; PAC (other pol. cmte) $806k.
- In 2026, $4.40M of $8.42M came from individuals; PAC (other pol. cmte) $1.77M.
BURCHETT, TIM
- In 2024, $1.07M of $1.24M came from individuals; PAC (other pol. cmte) $139k.
- In 2026, $2.83M of $3.13M came from individuals; PAC (other pol. cmte) $260k.
Short talking points — money & predicted voting
Open with the model set’s statewide call: GOP favored at about 4% Dem win probability on public campaign-finance + roster features — not a poll. Then the money shape: Tennessee federal candidates look balanced in 2026 weball (about $5.94M PAC / $14.07M individual of $26.59M total). Spotlight BLACKBURN, MARSHA MRS. for one concrete receipt picture. Close civic: these are public contribution patterns and a transparent forecast model call — not evidence of wrongdoing, and not a substitute for Cook or election-night counts.
TX — Texas
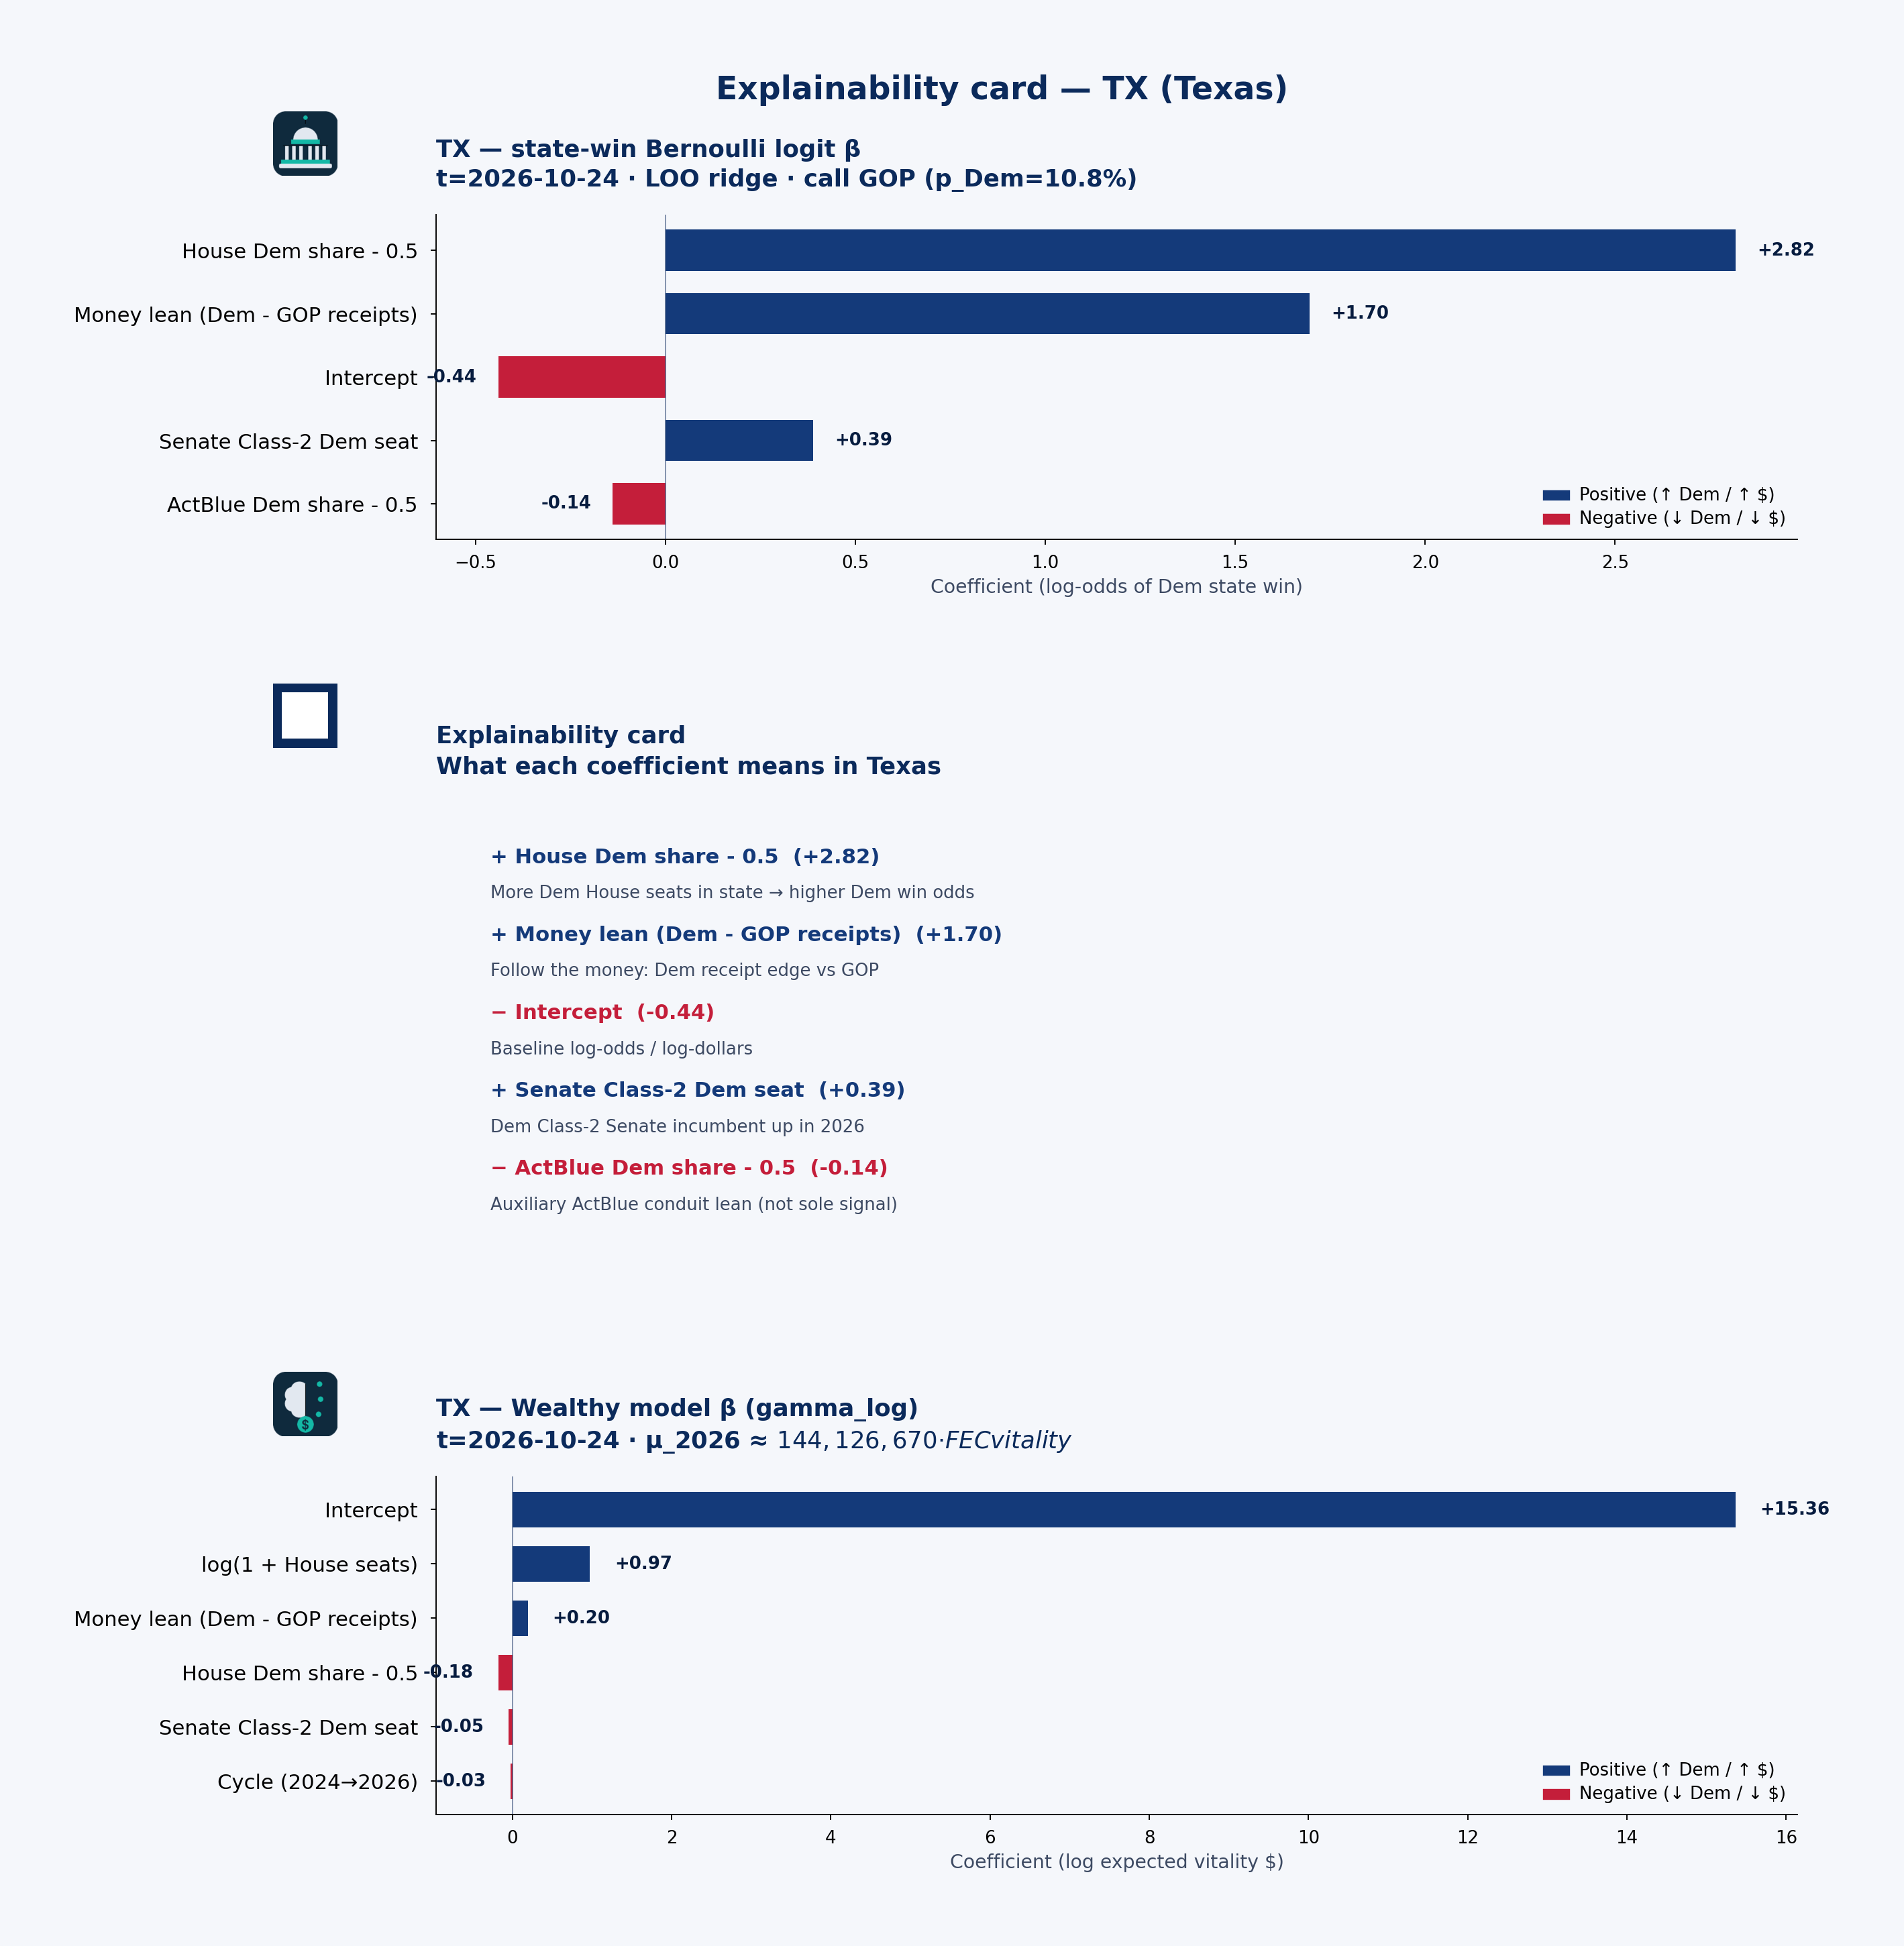 State explainability card · state-win LOO coefficient stability, plain language, and Wealthy model · TX · t=2026-10-24
Statewide call: GOP (p_Dem=11%) · 2026 money shape: individual-heavy
Receipts by cycle (campaign-finance weball)
| Cycle | Candidate | Total receipts | Individual | PAC (other pol. cmte) |
|---|---|---|---|---|
| 2024 | ALLRED, COLIN | $598k | $554k | $40k |
| 2024 | ALLRED, COLIN | $94.67M | $85.34M | $964k |
| 2026 | ALLRED, COLIN | $8.13M | $3.76M | $125k |
| 2026 | ALLRED, COLIN | $7.63M | $6.65M | $26k |
| 2024 | CORNYN, JOHN SEN | $3.38M | $1.27M | $595k |
| 2026 | CORNYN, JOHN SEN | $8.61M | $3.76M | $1.48M |
| 2024 | CROCKETT, JASMINE | $3.11M | $2.34M | $719k |
| 2026 | CROCKETT, JASMINE | $8.28M | $7.67M | $169k |
| 2026 | CROCKETT, JASMINE | $11.10M | $6.15M | $51k |
| 2024 | CRUZ, RAFAEL EDWARD TED | $74.05M | $67.44M | $1.26M |
| 2026 | CRUZ, RAFAEL EDWARD TED | $12.42M | $10.29M | $538k |
| 2026 | PAXTON, WARREN KENNETH JR. | $22.33M | $21.00M | $392k |
| 2026 | TALARICO, JAMES | $146.35M | $139.78M | $469k |
PAC & individual money
PAC money was about $29.83M of $297.66M total receipts in 2024 and $29.07M of $392.26M in 2026. Direct committee→candidate 24K (non-memo) ran about $31.67M (2024) / $27.92M (2026). Itemized individual share from Texas: 76.3% (2024) / 72.0% (2026).
TALARICO, JAMES: Cycle-to-date weball receipts ~$146.35M, with PAC direct 24K $0 → $388k vs 2024. the public campaign-finance data feed by-size individual totals are not loaded in this 50-state snapshot.
Spotlight candidates
TALARICO, JAMES
- In 2026, $139.78M of $146.35M came from individuals; PAC (other pol. cmte) $469k.
ALLRED, COLIN
- In 2024, $85.34M of $94.67M came from individuals; PAC (other pol. cmte) $964k.
- In 2026, $6.65M of $7.63M came from individuals; PAC (other pol. cmte) $26k.
CRUZ, RAFAEL EDWARD TED
- In 2024, $67.44M of $74.05M came from individuals; PAC (other pol. cmte) $1.26M.
- In 2026, $10.29M of $12.42M came from individuals; PAC (other pol. cmte) $538k.
Short talking points — money & predicted voting
Open with the model set’s statewide call: GOP favored at about 11% Dem win probability on public campaign-finance + roster features — not a poll. Then the money shape: Texas federal candidates look individual-heavy in 2026 weball (about $29.07M PAC / $282.34M individual of $392.26M total). Spotlight TALARICO, JAMES for one concrete receipt picture. Close civic: these are public contribution patterns and a transparent forecast model call — not evidence of wrongdoing, and not a substitute for Cook or election-night counts.
UT — Utah
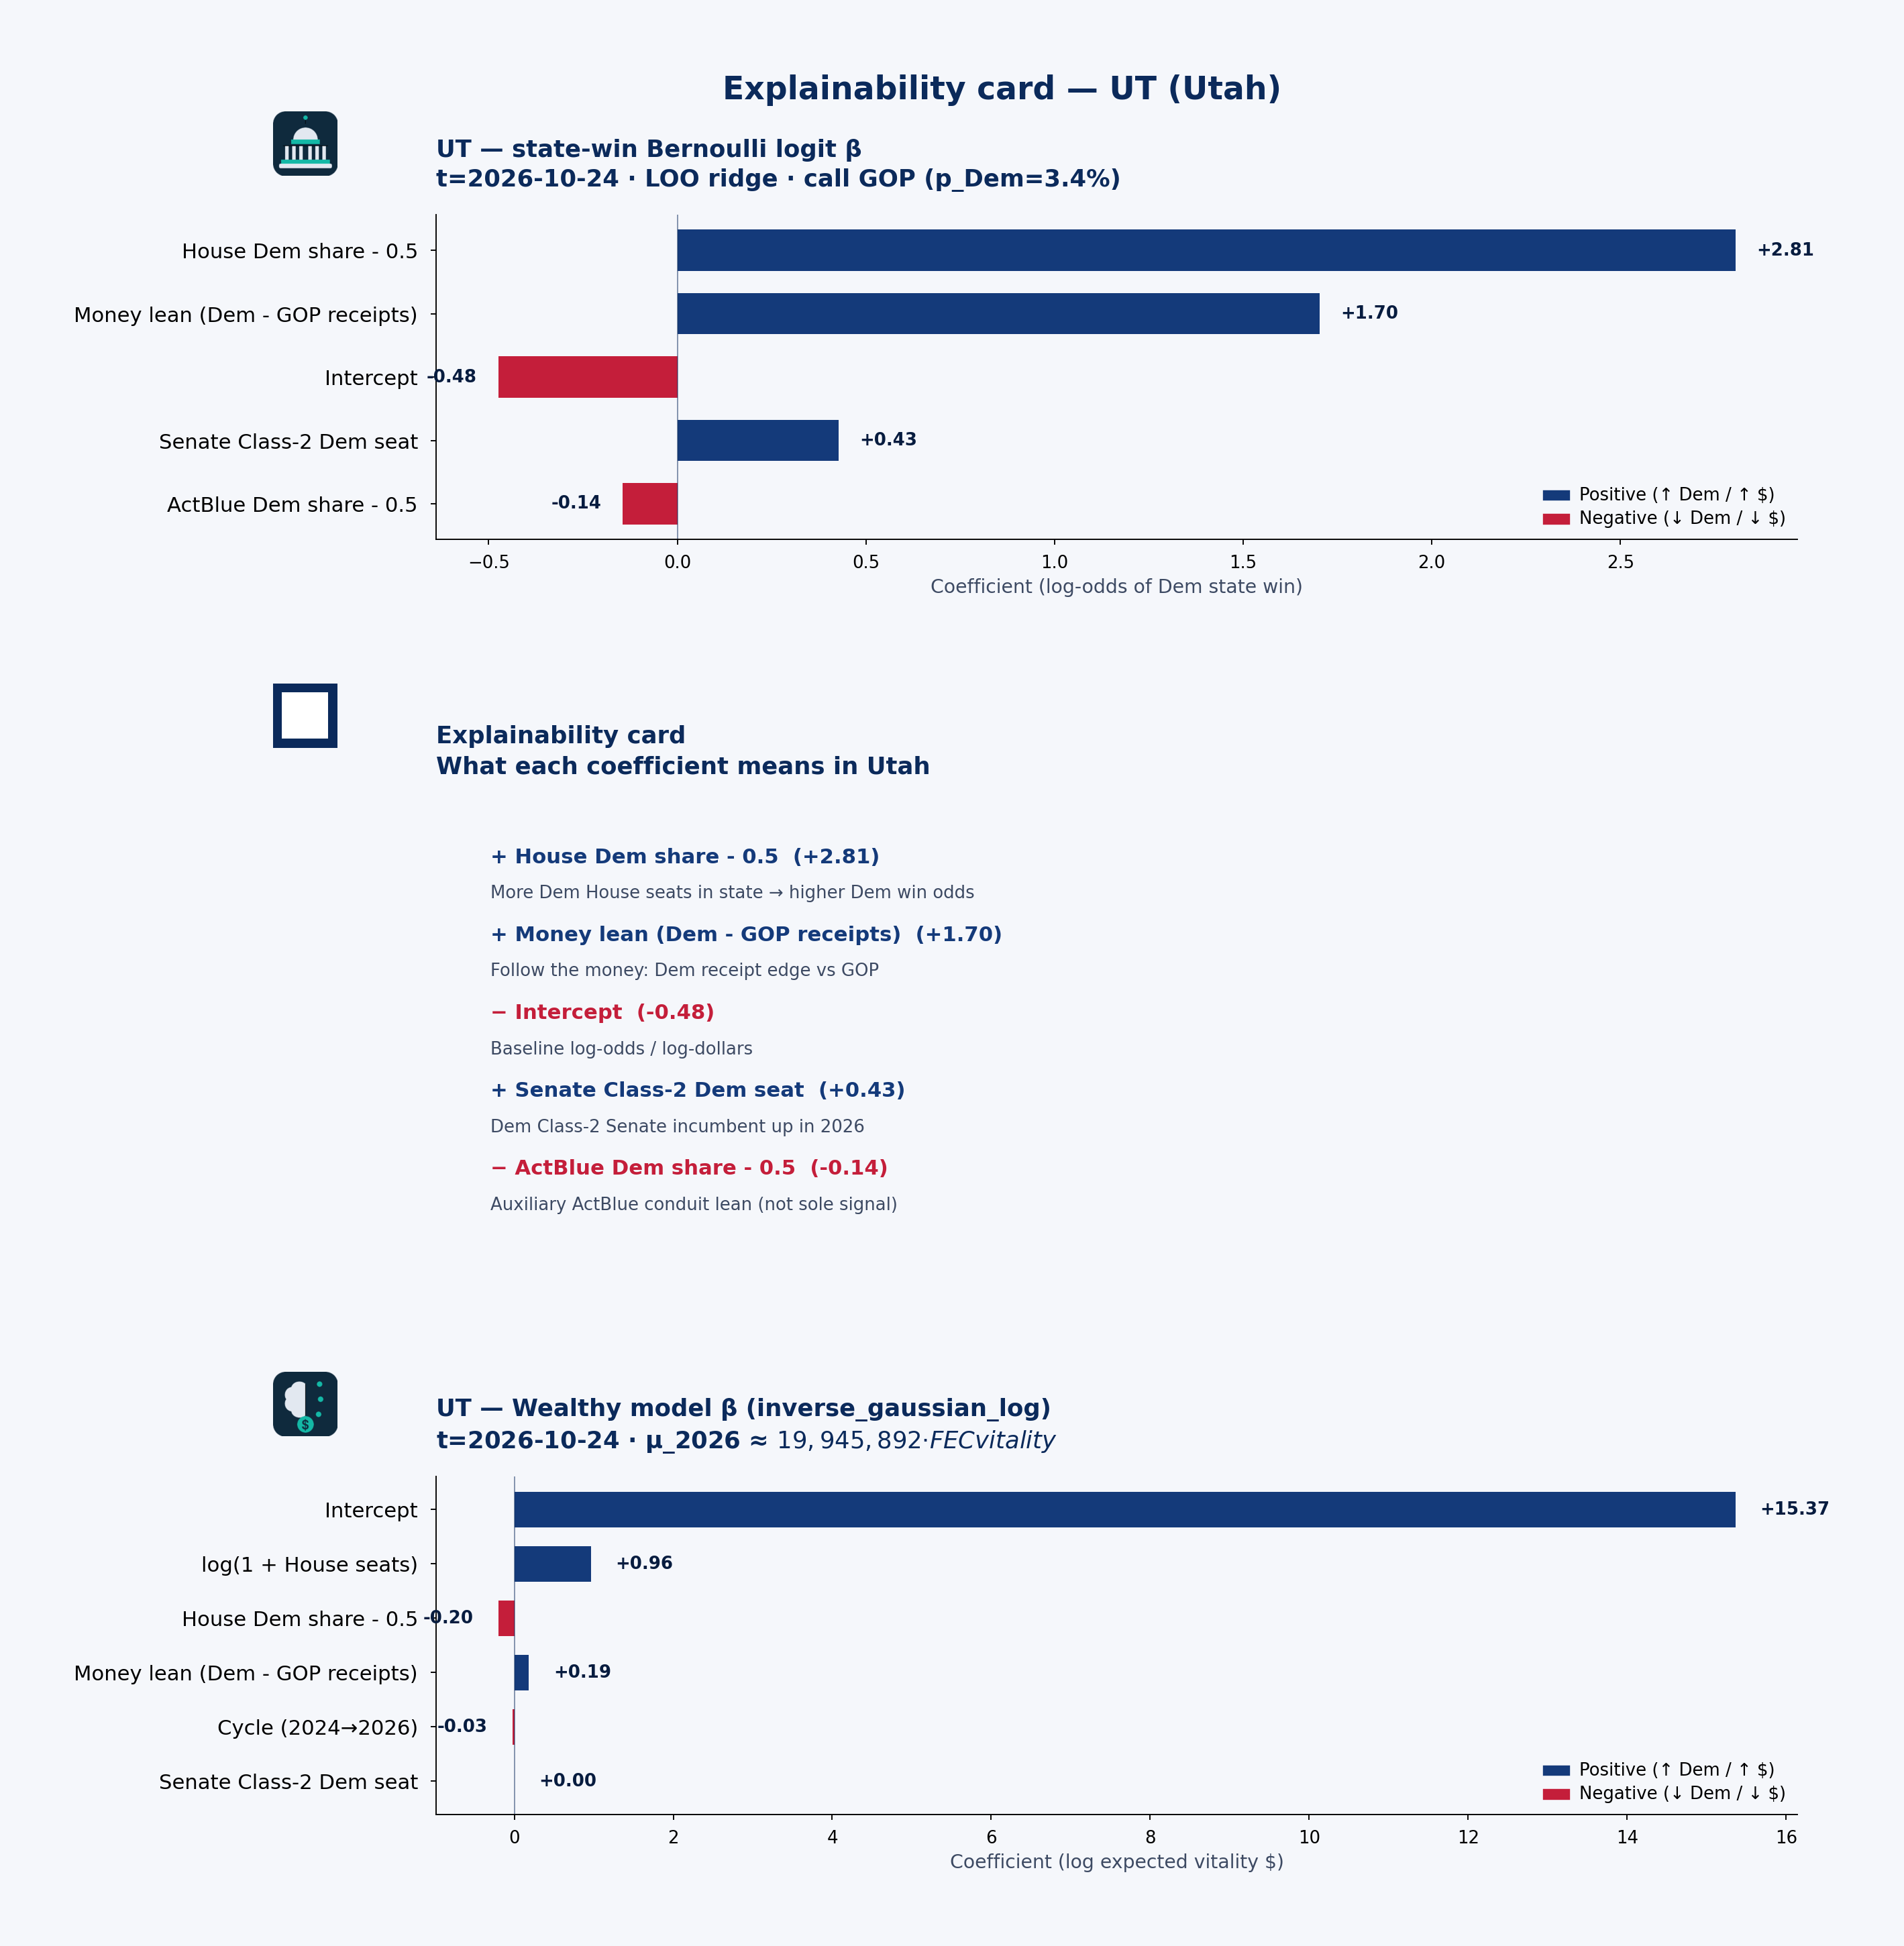 State explainability card · state-win LOO coefficient stability, plain language, and Wealthy model · UT · t=2026-10-24
Statewide call: GOP (p_Dem=3%) · 2026 money shape: balanced
Receipts by cycle (campaign-finance weball)
| Cycle | Candidate | Total receipts | Individual | PAC (other pol. cmte) |
|---|---|---|---|---|
| 2024 | CURTIS, JOHN | $5.75M | $2.32M | $2.05M |
| 2026 | CURTIS, JOHN | $862k | $407k | $454k |
| 2024 | KENNEDY, MIKE | $1.03M | $543k | $306k |
| 2026 | KENNEDY, MIKE | $1.21M | $511k | $644k |
| 2024 | LEE, MIKE | $5.14M | $5.01M | $85k |
| 2026 | LEE, MIKE | $2.53M | $2.11M | $265k |
| 2024 | MALOY, CELESTE | $1.92M | $857k | $922k |
| 2026 | MALOY, CELESTE | $1.65M | $768k | $786k |
| 2024 | MOORE, BLAKE | $2.63M | $952k | $1.47M |
| 2026 | MOORE, BLAKE | $2.80M | $1.07M | $1.60M |
| 2024 | OWENS, BURGESS | $1.47M | $999k | $400k |
| 2026 | OWENS, BURGESS | $736k | $512k | $152k |
PAC & individual money
PAC money was about $5.23M of $17.95M total receipts in 2024 and $3.90M of $9.79M in 2026. Direct committee→candidate 24K (non-memo) ran about $4.17M (2024) / $3.68M (2026). Itemized individual share from Utah: 59.5% (2024) / 55.0% (2026).
CURTIS, JOHN: Cycle-to-date weball receipts ~$862k, with PAC direct 24K $929k → $444k vs 2024. the public campaign-finance data feed by-size individual totals are not loaded in this 50-state snapshot.
Spotlight candidates
CURTIS, JOHN
- In 2024, $2.32M of $5.75M came from individuals; PAC (other pol. cmte) $2.05M.
- In 2026, $407k of $862k came from individuals; PAC (other pol. cmte) $454k.
LEE, MIKE
- In 2024, $5.01M of $5.14M came from individuals; PAC (other pol. cmte) $85k.
- In 2026, $2.11M of $2.53M came from individuals; PAC (other pol. cmte) $265k.
MOORE, BLAKE
- In 2024, $952k of $2.63M came from individuals; PAC (other pol. cmte) $1.47M.
- In 2026, $1.07M of $2.80M came from individuals; PAC (other pol. cmte) $1.60M.
Short talking points — money & predicted voting
Open with the model set’s statewide call: GOP favored at about 3% Dem win probability on public campaign-finance + roster features — not a poll. Then the money shape: Utah federal candidates look balanced in 2026 weball (about $3.90M PAC / $5.38M individual of $9.79M total). Spotlight CURTIS, JOHN for one concrete receipt picture. Close civic: these are public contribution patterns and a transparent forecast model call — not evidence of wrongdoing, and not a substitute for Cook or election-night counts.
VA — Virginia
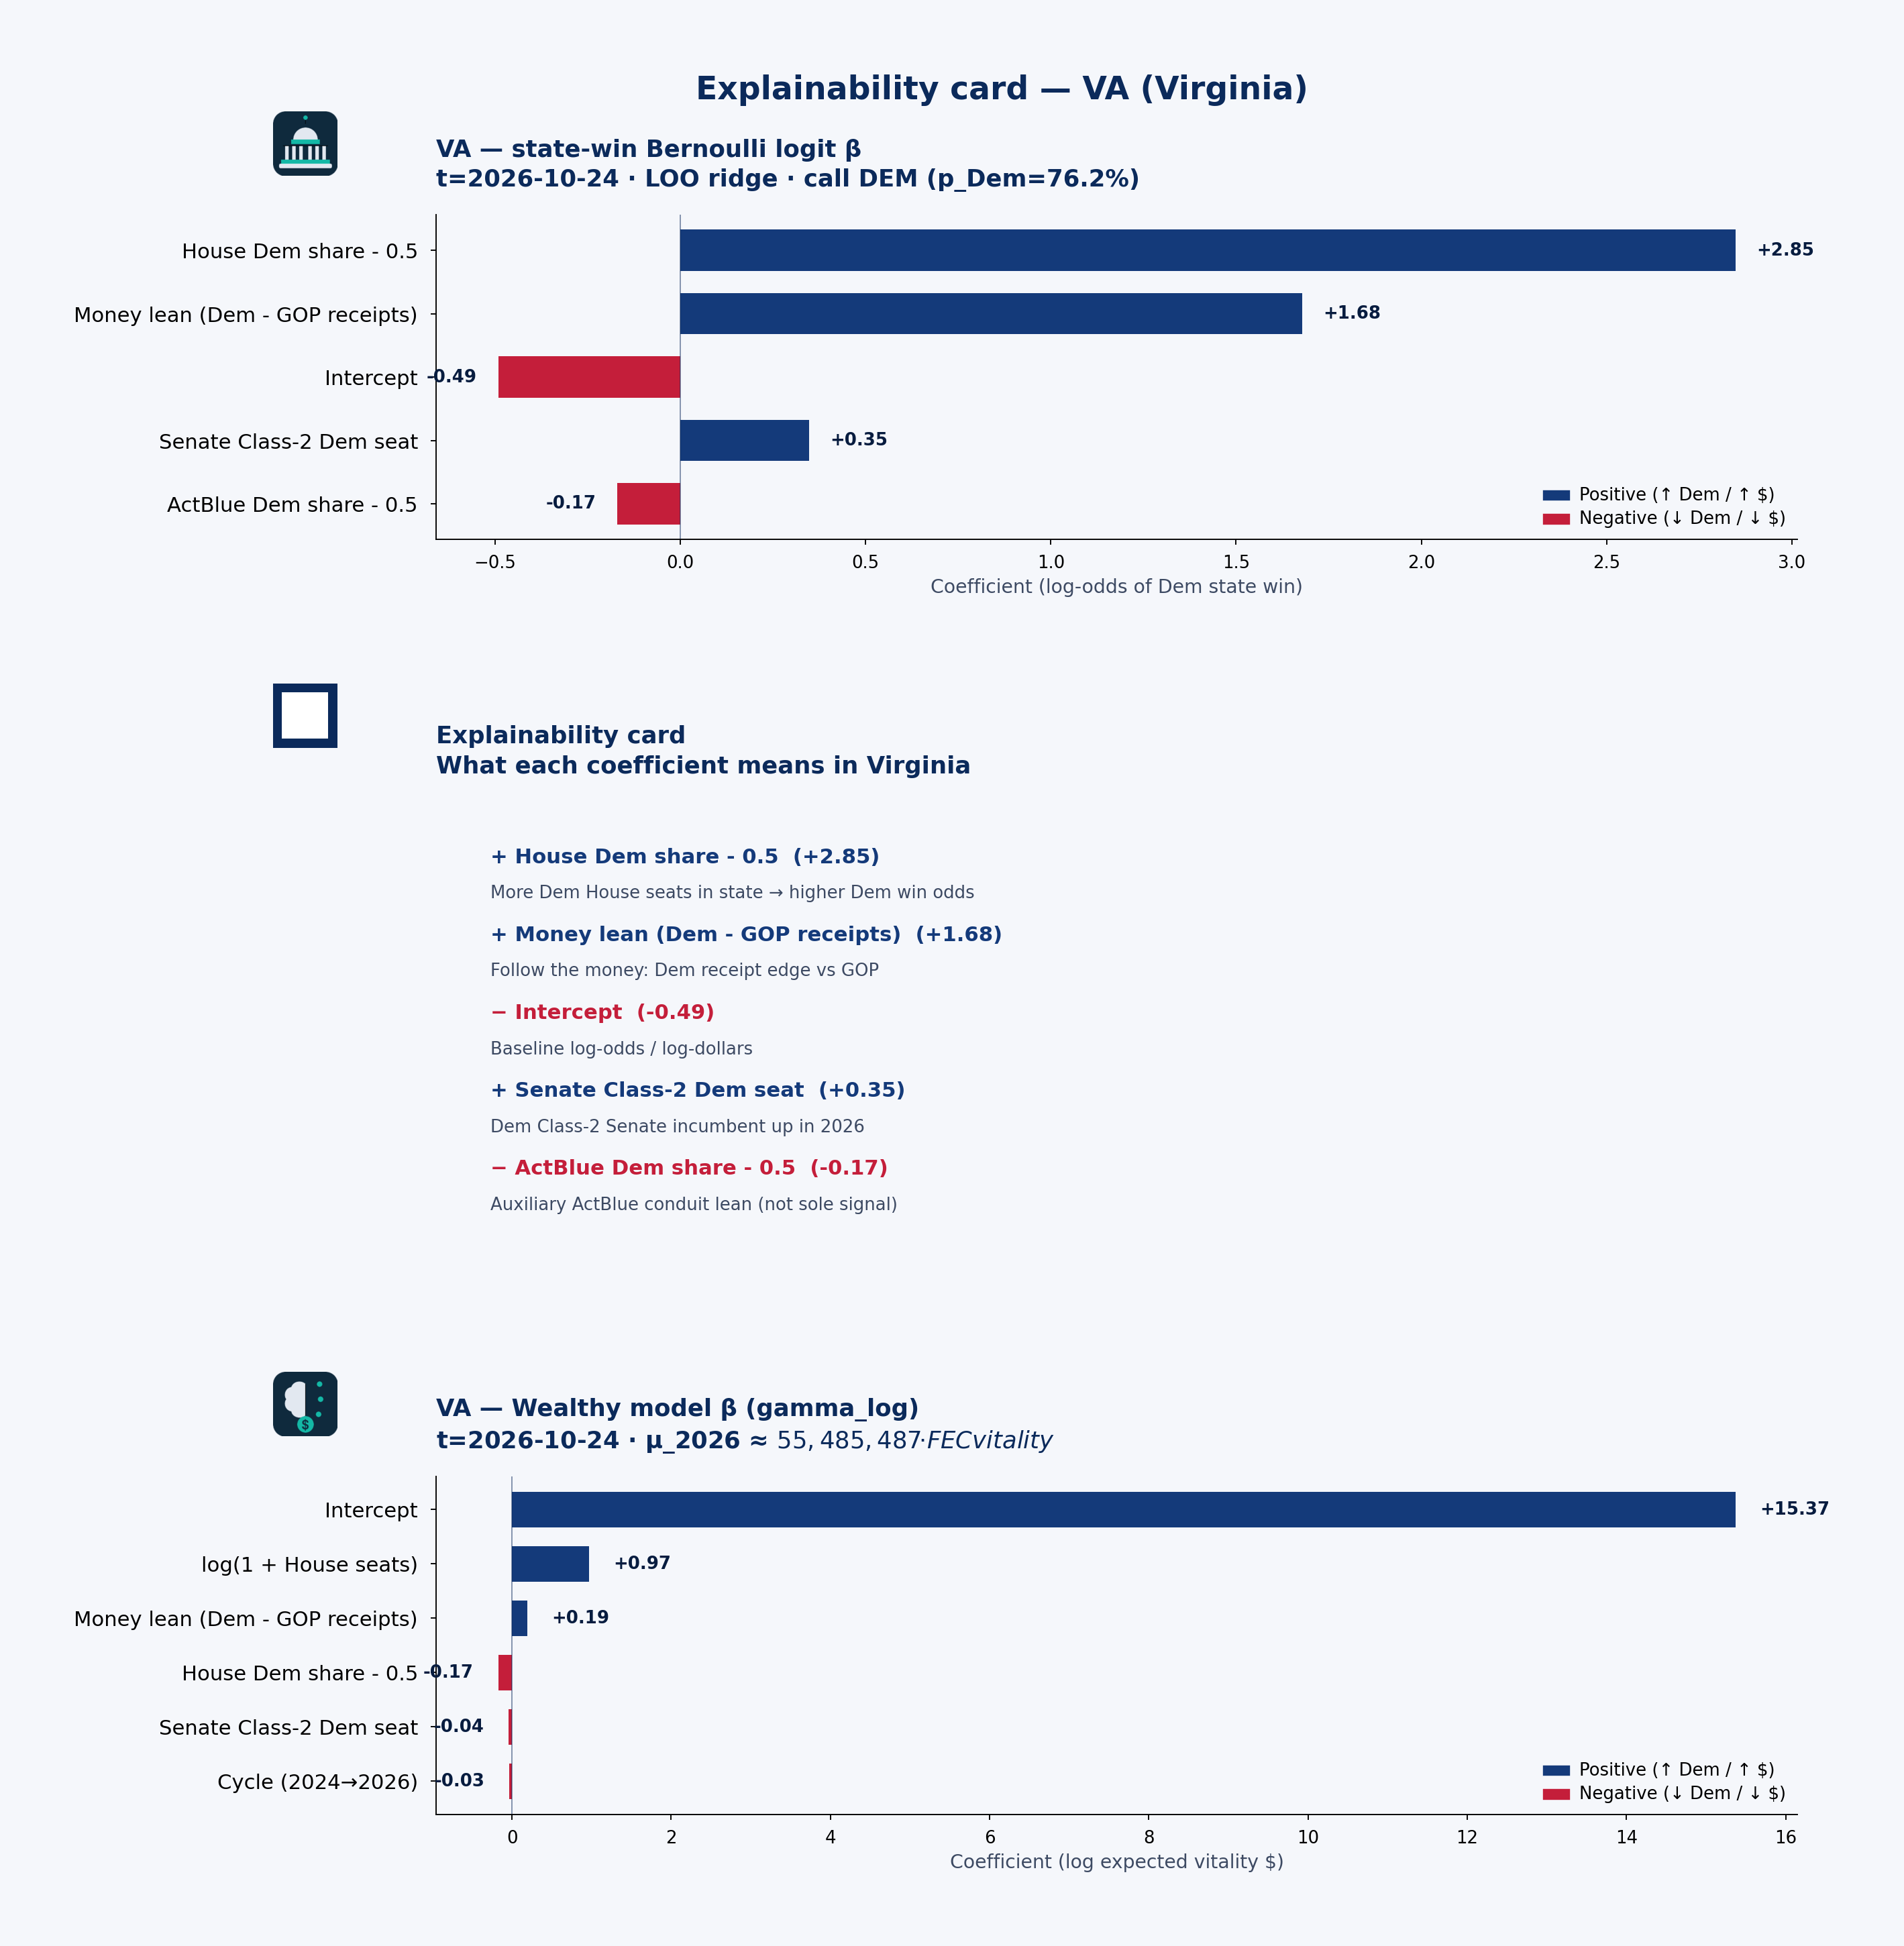 State explainability card · state-win LOO coefficient stability, plain language, and Wealthy model · VA · t=2026-10-24
Statewide call: DEM (p_Dem=76%) · 2026 money shape: balanced
Receipts by cycle (campaign-finance weball)
| Cycle | Candidate | Total receipts | Individual | PAC (other pol. cmte) |
|---|---|---|---|---|
| 2024 | KAINE, TIMOTHY MICHAEL | $18.31M | $10.89M | $2.11M |
| 2026 | KAINE, TIMOTHY MICHAEL | $903k | $454k | $152k |
| 2024 | KIGGANS, JENNIFER | $6.48M | $3.67M | $1.63M |
| 2026 | KIGGANS, JENNIFER | $7.59M | $4.09M | $1.55M |
| 2024 | MCCLELLAN, JENNIFER | $2.77M | $1.94M | $765k |
| 2026 | MCCLELLAN, JENNIFER | $1.55M | $730k | $815k |
| 2024 | SUBRAMANYAM, SUHAS | $2.93M | $2.34M | $365k |
| 2026 | SUBRAMANYAM, SUHAS | $1.71M | $1.19M | $447k |
| 2024 | VINDMAN, YEVGENY 'EUGENE' | $18.10M | $17.43M | $394k |
| 2026 | VINDMAN, YEVGENY 'EUGENE' | $16.34M | $14.97M | $1000k |
| 2026 | WALKINSHAW, JAMES | $3.27M | $2.09M | $1.14M |
| 2024 | WARNER, MARK ROBERT | $4.27M | $2.24M | $711k |
| 2026 | WARNER, MARK ROBERT | $20.22M | $10.41M | $2.48M |
| 2024 | WITTMAN, ROBERT J. MR. | $2.85M | $1.41M | $975k |
| 2026 | WITTMAN, ROBERT J. MR. | $5.43M | $1.95M | $1.51M |
PAC & individual money
PAC money was about $9.40M of $60.55M total receipts in 2024 and $13.05M of $66.93M in 2026. Direct committee→candidate 24K (non-memo) ran about $9.49M (2024) / $11.36M (2026). Itemized individual share from Virginia: 69.8% (2024) / 61.7% (2026).
WARNER, MARK ROBERT: Cycle-to-date weball receipts ~$20.22M, with PAC direct 24K $744k → $2.33M vs 2024. the public campaign-finance data feed by-size individual totals are not loaded in this 50-state snapshot.
Spotlight candidates
WARNER, MARK ROBERT
- In 2024, $2.24M of $4.27M came from individuals; PAC (other pol. cmte) $711k.
- In 2026, $10.41M of $20.22M came from individuals; PAC (other pol. cmte) $2.48M.
KAINE, TIMOTHY MICHAEL
- In 2024, $10.89M of $18.31M came from individuals; PAC (other pol. cmte) $2.11M.
- In 2026, $454k of $903k came from individuals; PAC (other pol. cmte) $152k.
VINDMAN, YEVGENY 'EUGENE'
- In 2024, $17.43M of $18.10M came from individuals; PAC (other pol. cmte) $394k.
- In 2026, $14.97M of $16.34M came from individuals; PAC (other pol. cmte) $1000k.
Short talking points — money & predicted voting
Open with the model set’s statewide call: DEM favored at about 76% Dem win probability on public campaign-finance + roster features — not a poll. Then the money shape: Virginia federal candidates look balanced in 2026 weball (about $13.05M PAC / $41.30M individual of $66.93M total). Spotlight WARNER, MARK ROBERT for one concrete receipt picture. Close civic: these are public contribution patterns and a transparent forecast model call — not evidence of wrongdoing, and not a substitute for Cook or election-night counts.
VT — Vermont
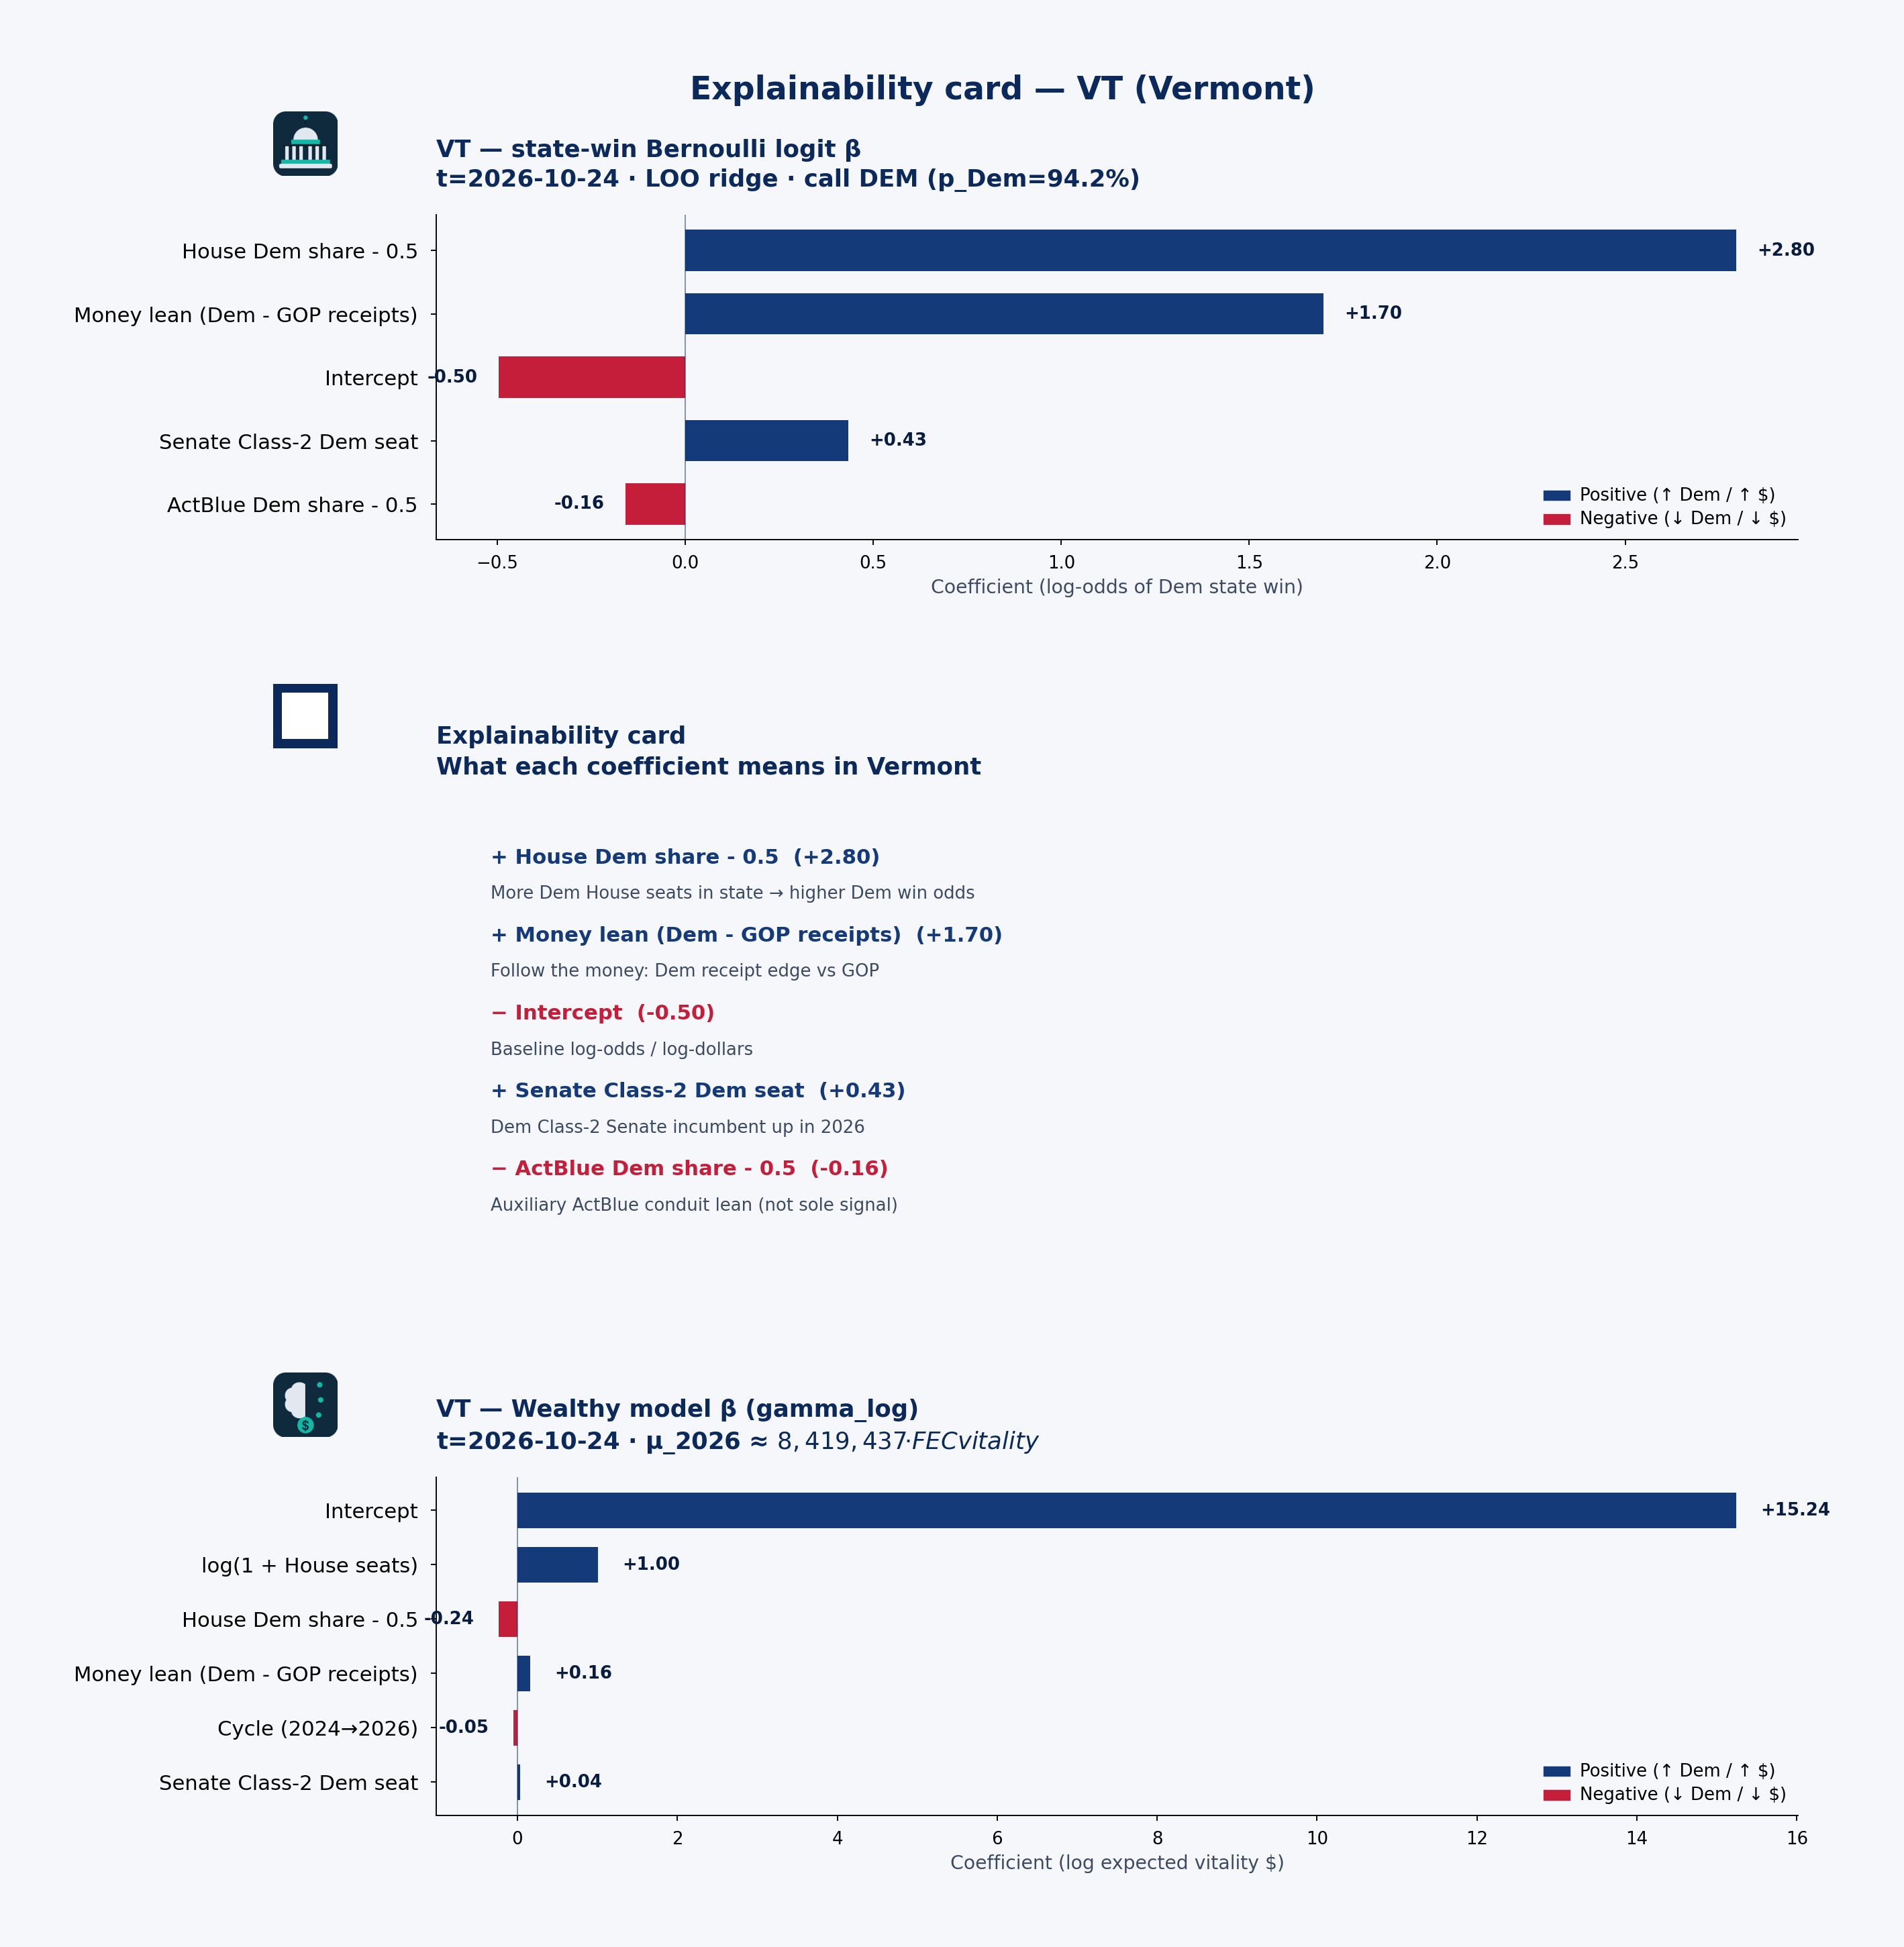 State explainability card · state-win LOO coefficient stability, plain language, and Wealthy model · VT · t=2026-10-24
Statewide call: DEM (p_Dem=94%) · 2026 money shape: individual-heavy
Receipts by cycle (campaign-finance weball)
| Cycle | Candidate | Total receipts | Individual | PAC (other pol. cmte) |
|---|---|---|---|---|
| 2024 | BALINT, REBECCA 'BECCA' | $1.39M | $1.02M | $366k |
| 2026 | BALINT, REBECCA 'BECCA' | $1.18M | $830k | $343k |
| 2024 | SANDERS, BERNARD | $8.21M | $7.24M | $89k |
| 2026 | SANDERS, BERNARD | $26.48M | $25.08M | $27 |
| 2024 | WELCH, PETER | $331k | $67k | $43k |
| 2026 | WELCH, PETER | $249k | $79k | $45k |
PAC & individual money
PAC money was about $498k of $9.93M total receipts in 2024 and $388k of $27.90M in 2026. Direct committee→candidate 24K (non-memo) ran about $539k (2024) / $361k (2026). Itemized individual share from Vermont: 83.8% (2024) / 93.1% (2026).
SANDERS, BERNARD: Cycle-to-date weball receipts ~$26.48M, with PAC direct 24K $118k → $0 vs 2024. the public campaign-finance data feed by-size individual totals are not loaded in this 50-state snapshot.
Spotlight candidates
SANDERS, BERNARD
- In 2024, $7.24M of $8.21M came from individuals; PAC (other pol. cmte) $89k.
- In 2026, $25.08M of $26.48M came from individuals; PAC (other pol. cmte) $27.
BALINT, REBECCA 'BECCA'
- In 2024, $1.02M of $1.39M came from individuals; PAC (other pol. cmte) $366k.
- In 2026, $830k of $1.18M came from individuals; PAC (other pol. cmte) $343k.
WELCH, PETER
- In 2024, $67k of $331k came from individuals; PAC (other pol. cmte) $43k.
- In 2026, $79k of $249k came from individuals; PAC (other pol. cmte) $45k.
Short talking points — money & predicted voting
Open with the model set’s statewide call: DEM favored at about 94% Dem win probability on public campaign-finance + roster features — not a poll. Then the money shape: Vermont federal candidates look individual-heavy in 2026 weball (about $388k PAC / $25.99M individual of $27.90M total). Spotlight SANDERS, BERNARD for one concrete receipt picture. Close civic: these are public contribution patterns and a transparent forecast model call — not evidence of wrongdoing, and not a substitute for Cook or election-night counts.
WA — Washington
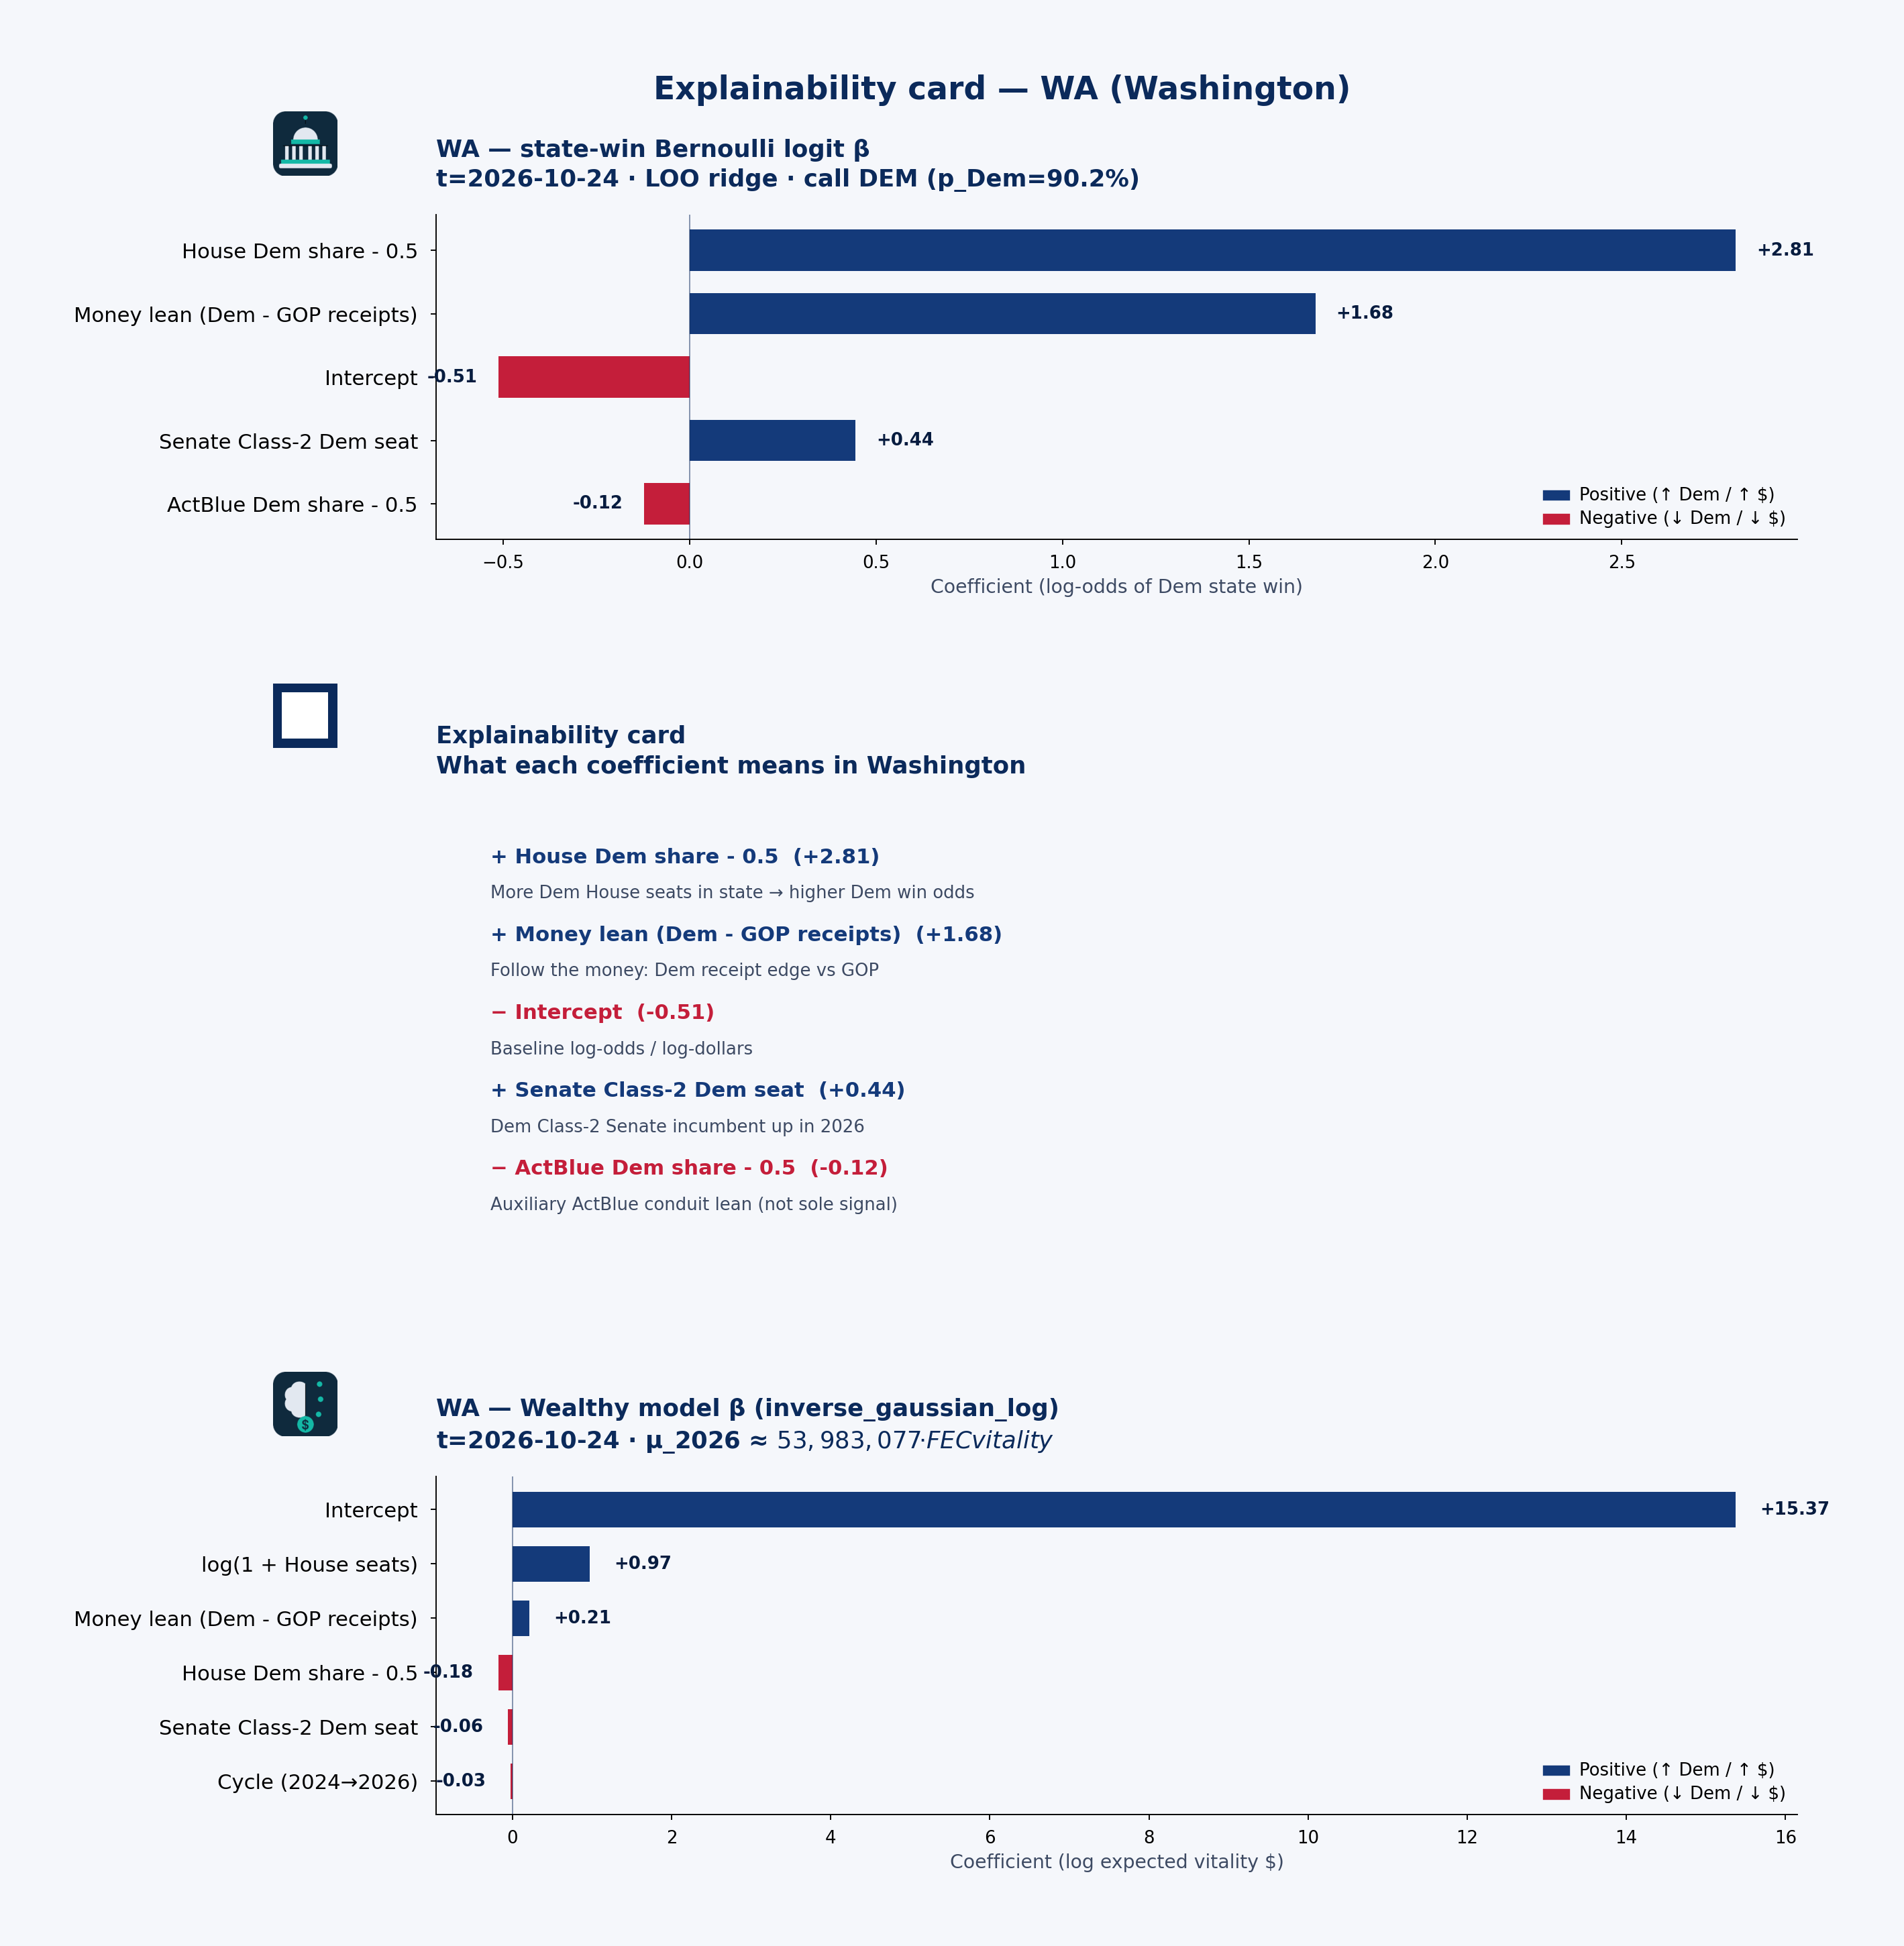 State explainability card · state-win LOO coefficient stability, plain language, and Wealthy model · WA · t=2026-10-24
Statewide call: DEM (p_Dem=90%) · 2026 money shape: balanced
Receipts by cycle (campaign-finance weball)
| Cycle | Candidate | Total receipts | Individual | PAC (other pol. cmte) |
|---|---|---|---|---|
| 2024 | CANTWELL, MARIA | $11.15M | $10.13M | $77k |
| 2026 | CANTWELL, MARIA | $985k | $982k | $0 |
| 2024 | DELBENE, SUZAN K | $3.85M | $1.64M | $1.81M |
| 2026 | DELBENE, SUZAN K | $4.28M | $2.19M | $1.78M |
| 2024 | GLUESENKAMP PEREZ, MARIE | $11.86M | $9.32M | $1.34M |
| 2026 | GLUESENKAMP PEREZ, MARIE | $9.47M | $4.37M | $1.10M |
| 2024 | JAYAPAL, PRAMILA | $2.82M | $2.39M | $421k |
| 2026 | JAYAPAL, PRAMILA | $2.92M | $2.49M | $362k |
| 2024 | LARSEN, RICK | $2.45M | $966k | $1.47M |
| 2026 | LARSEN, RICK | $2.63M | $1.05M | $1.54M |
| 2024 | MURRAY, PATTY | $2.10M | $1.70M | $284k |
| 2026 | MURRAY, PATTY | $3.59M | $3.17M | $338k |
| 2024 | NEWHOUSE, DAN | $2.51M | $989k | $1.45M |
| 2026 | NEWHOUSE, DAN | $724k | $245k | $381k |
| 2024 | SCHRIER, KIM DR. | $6.53M | $5.08M | $1.29M |
| 2026 | SCHRIER, KIM DR. | $3.77M | $2.56M | $1.14M |
PAC & individual money
PAC money was about $10.48M of $50.50M total receipts in 2024 and $9.09M of $36.09M in 2026. Direct committee→candidate 24K (non-memo) ran about $10.81M (2024) / $8.20M (2026). Itemized individual share from Washington: 73.1% (2024) / 61.6% (2026).
GLUESENKAMP PEREZ, MARIE: Cycle-to-date weball receipts ~$9.47M, with PAC direct 24K $1.37M → $958k vs 2024. the public campaign-finance data feed by-size individual totals are not loaded in this 50-state snapshot.
Spotlight candidates
GLUESENKAMP PEREZ, MARIE
- In 2024, $9.32M of $11.86M came from individuals; PAC (other pol. cmte) $1.34M.
- In 2026, $4.37M of $9.47M came from individuals; PAC (other pol. cmte) $1.10M.
CANTWELL, MARIA
- In 2024, $10.13M of $11.15M came from individuals; PAC (other pol. cmte) $77k.
- In 2026, $982k of $985k came from individuals; PAC (other pol. cmte) $0.
SCHRIER, KIM DR.
- In 2024, $5.08M of $6.53M came from individuals; PAC (other pol. cmte) $1.29M.
- In 2026, $2.56M of $3.77M came from individuals; PAC (other pol. cmte) $1.14M.
Short talking points — money & predicted voting
Open with the model set’s statewide call: DEM favored at about 90% Dem win probability on public campaign-finance + roster features — not a poll. Then the money shape: Washington federal candidates look balanced in 2026 weball (about $9.09M PAC / $22.25M individual of $36.09M total). Spotlight GLUESENKAMP PEREZ, MARIE for one concrete receipt picture. Close civic: these are public contribution patterns and a transparent forecast model call — not evidence of wrongdoing, and not a substitute for Cook or election-night counts.
WI — Wisconsin
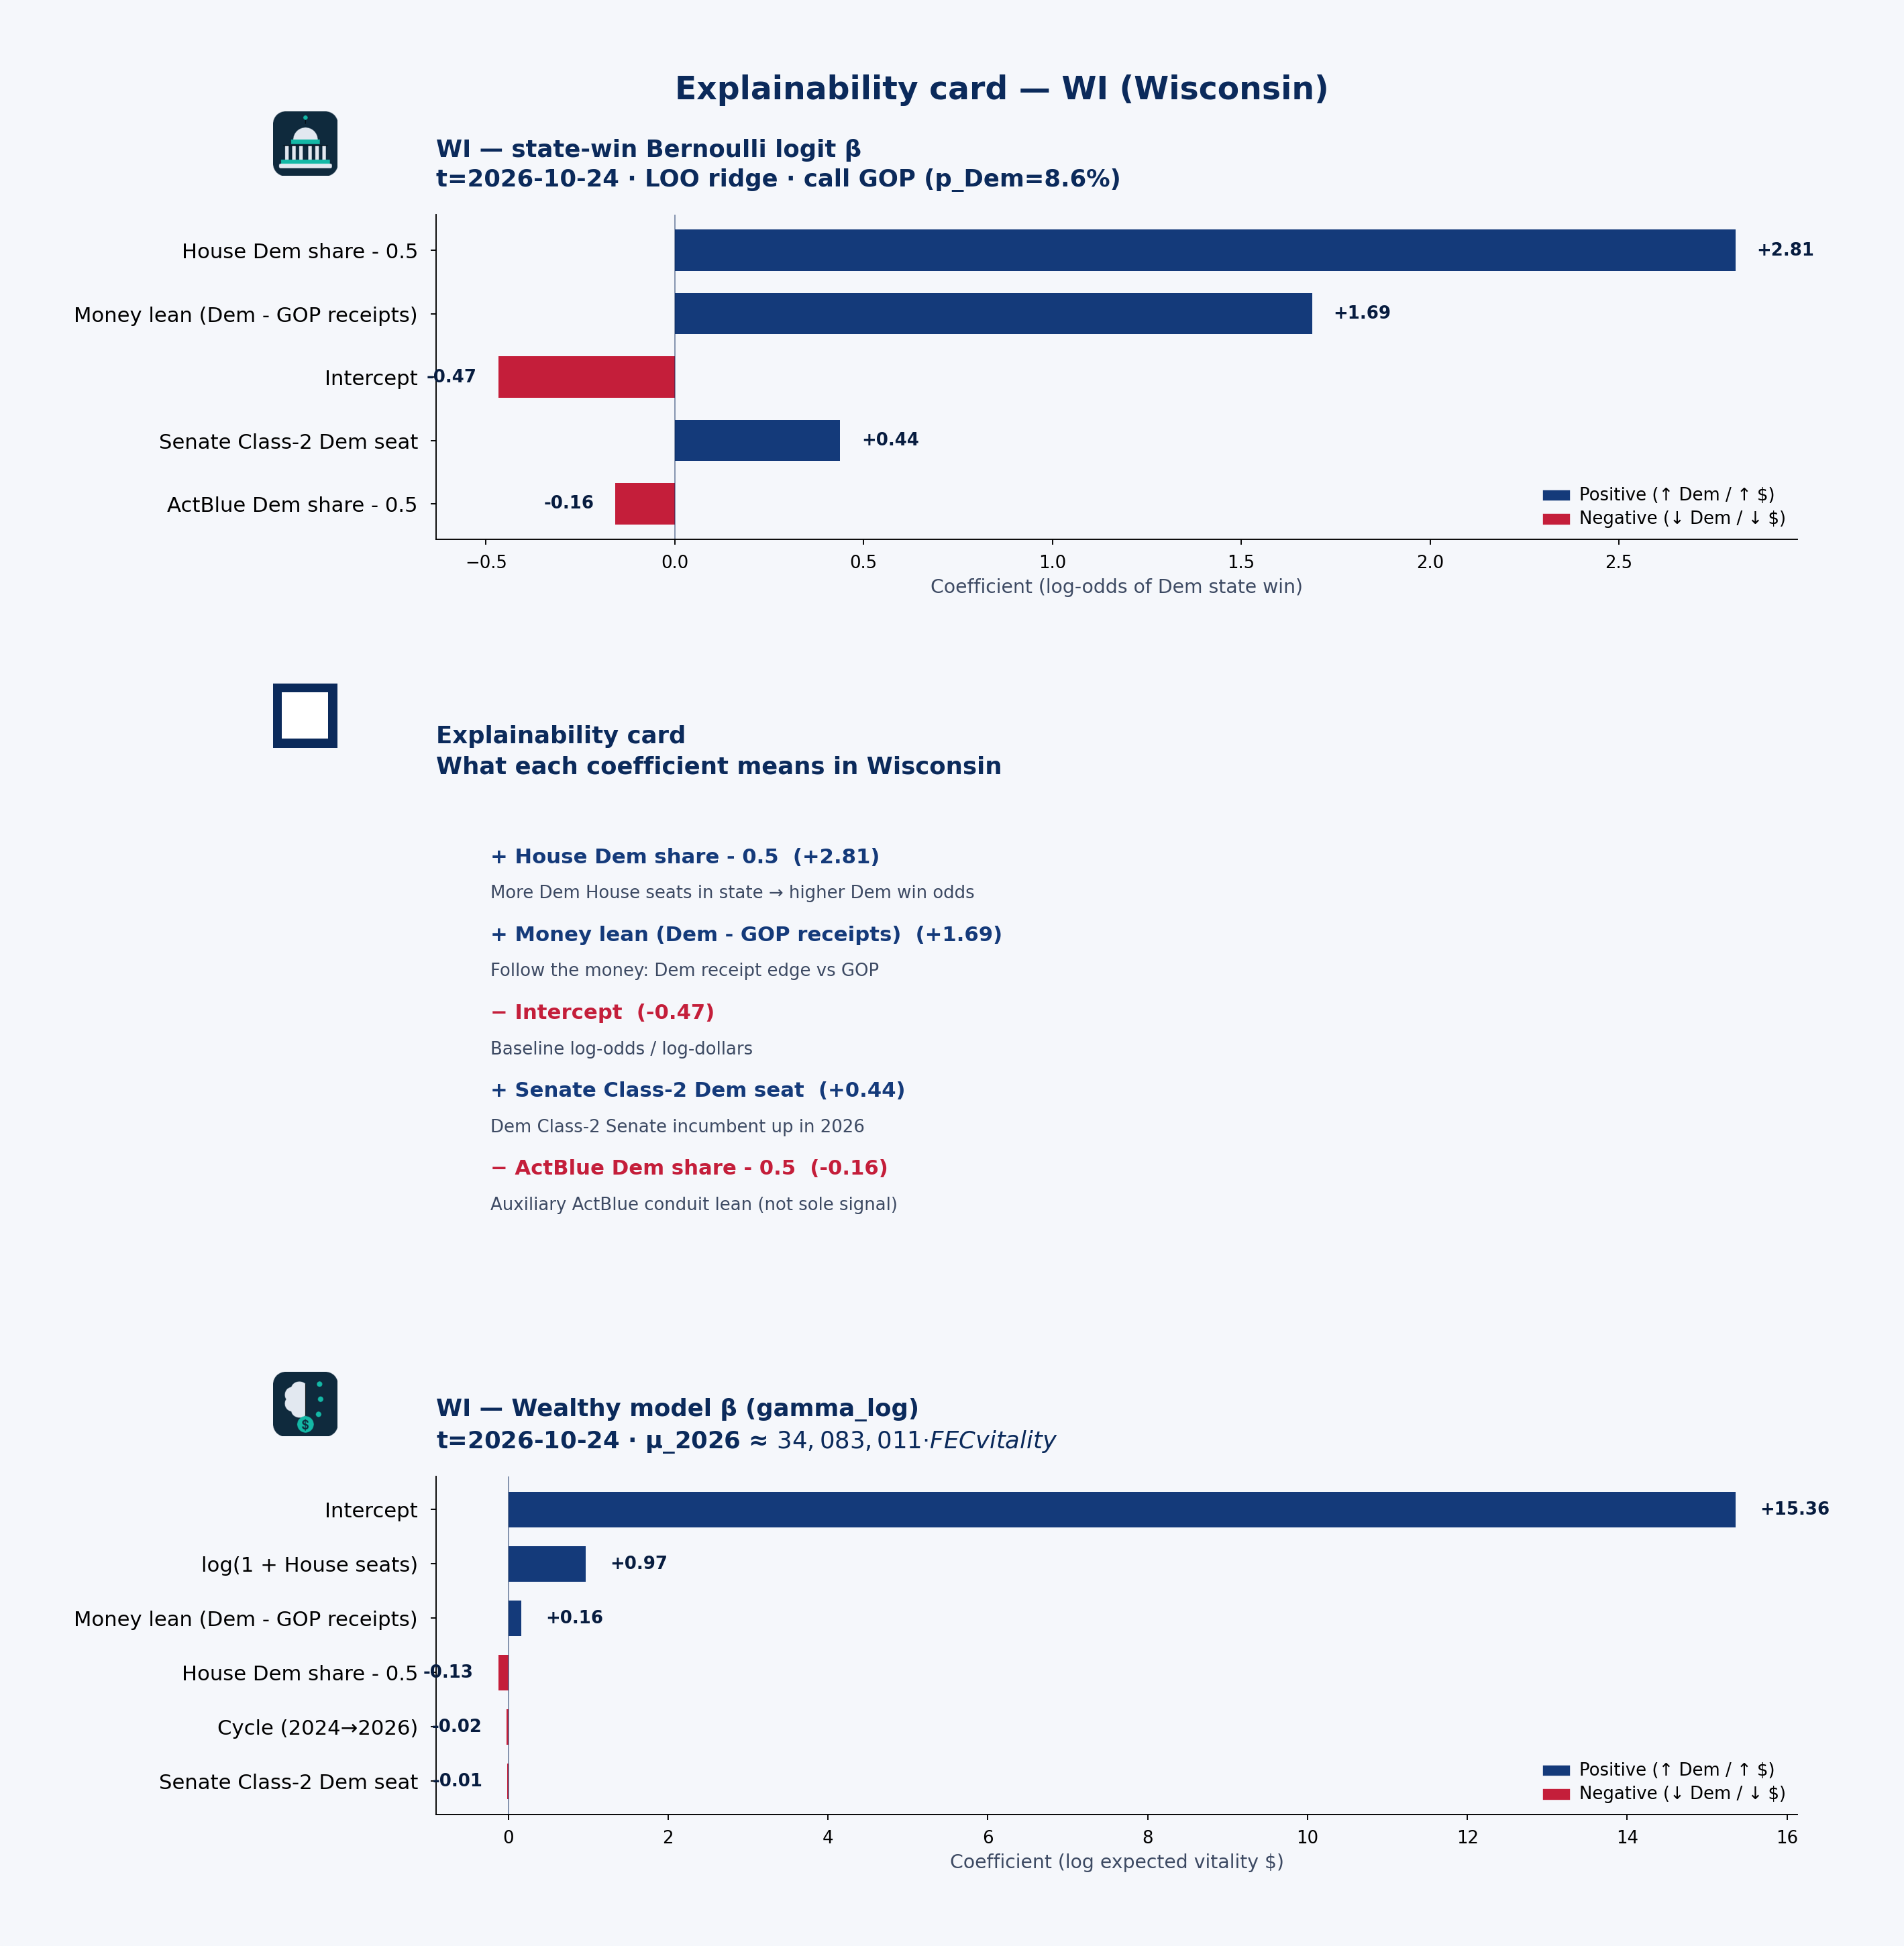 State explainability card · state-win LOO coefficient stability, plain language, and Wealthy model · WI · t=2026-10-24
Statewide call: GOP (p_Dem=9%) · 2026 money shape: individual-heavy
Receipts by cycle (campaign-finance weball)
| Cycle | Candidate | Total receipts | Individual | PAC (other pol. cmte) |
|---|---|---|---|---|
| 2024 | BALDWIN, TAMMY | $50.23M | $42.08M | $2.61M |
| 2026 | BALDWIN, TAMMY | $3.48M | $3.05M | $231k |
| 2024 | COOKE, REBECCA | $6.36M | $5.79M | $467k |
| 2024 | COOKE, REBECCA | $6.36M | $5.79M | $467k |
| 2026 | COOKE, REBECCA | $12.68M | $10.94M | $789k |
| 2026 | COOKE, REBECCA | $12.68M | $10.94M | $789k |
| 2024 | HOVDE, ERIC | $31.96M | $9.29M | $424k |
| 2026 | HOVDE, ERIC | $-2k | $-2k | $0 |
| 2024 | HOVDE, ERIC D | $31.96M | $9.29M | $424k |
| 2026 | HOVDE, ERIC D | $-2k | $-2k | $0 |
| 2024 | JOHNSON, RON HAROLD MR. | $5.37M | $5.15M | $36k |
| 2026 | JOHNSON, RON HAROLD MR. | $1.23M | $1.12M | $40k |
| 2024 | STEIL, BRYAN GEORGE | $5.62M | $2.32M | $2.08M |
| 2026 | STEIL, BRYAN GEORGE | $6.39M | $1.79M | $1.93M |
| 2024 | VAN ORDEN, DERRICK F. MR. | $7.66M | $5.01M | $1.02M |
| 2026 | VAN ORDEN, DERRICK F. MR. | $9.10M | $5.29M | $1.26M |
PAC & individual money
PAC money was about $11.70M of $164.71M total receipts in 2024 and $9.38M of $65.19M in 2026. Direct committee→candidate 24K (non-memo) ran about $11.02M (2024) / $7.36M (2026). Itemized individual share from Wisconsin: 59.3% (2024) / 65.3% (2026).
BALDWIN, TAMMY: Cycle-to-date weball receipts ~$3.48M, with PAC direct 24K $2.80M → $202k vs 2024. the public campaign-finance data feed by-size individual totals are not loaded in this 50-state snapshot.
Spotlight candidates
BALDWIN, TAMMY
- In 2024, $42.08M of $50.23M came from individuals; PAC (other pol. cmte) $2.61M.
- In 2026, $3.05M of $3.48M came from individuals; PAC (other pol. cmte) $231k.
HOVDE, ERIC
- In 2024, $9.29M of $31.96M came from individuals; PAC (other pol. cmte) $424k.
- In 2026, $-2k of $-2k came from individuals; PAC (other pol. cmte) $0.
HOVDE, ERIC D
- In 2024, $9.29M of $31.96M came from individuals; PAC (other pol. cmte) $424k.
- In 2026, $-2k of $-2k came from individuals; PAC (other pol. cmte) $0.
Short talking points — money & predicted voting
Open with the model set’s statewide call: GOP favored at about 9% Dem win probability on public campaign-finance + roster features — not a poll. Then the money shape: Wisconsin federal candidates look individual-heavy in 2026 weball (about $9.38M PAC / $42.59M individual of $65.19M total). Spotlight BALDWIN, TAMMY for one concrete receipt picture. Close civic: these are public contribution patterns and a transparent forecast model call — not evidence of wrongdoing, and not a substitute for Cook or election-night counts.
WV — West Virginia
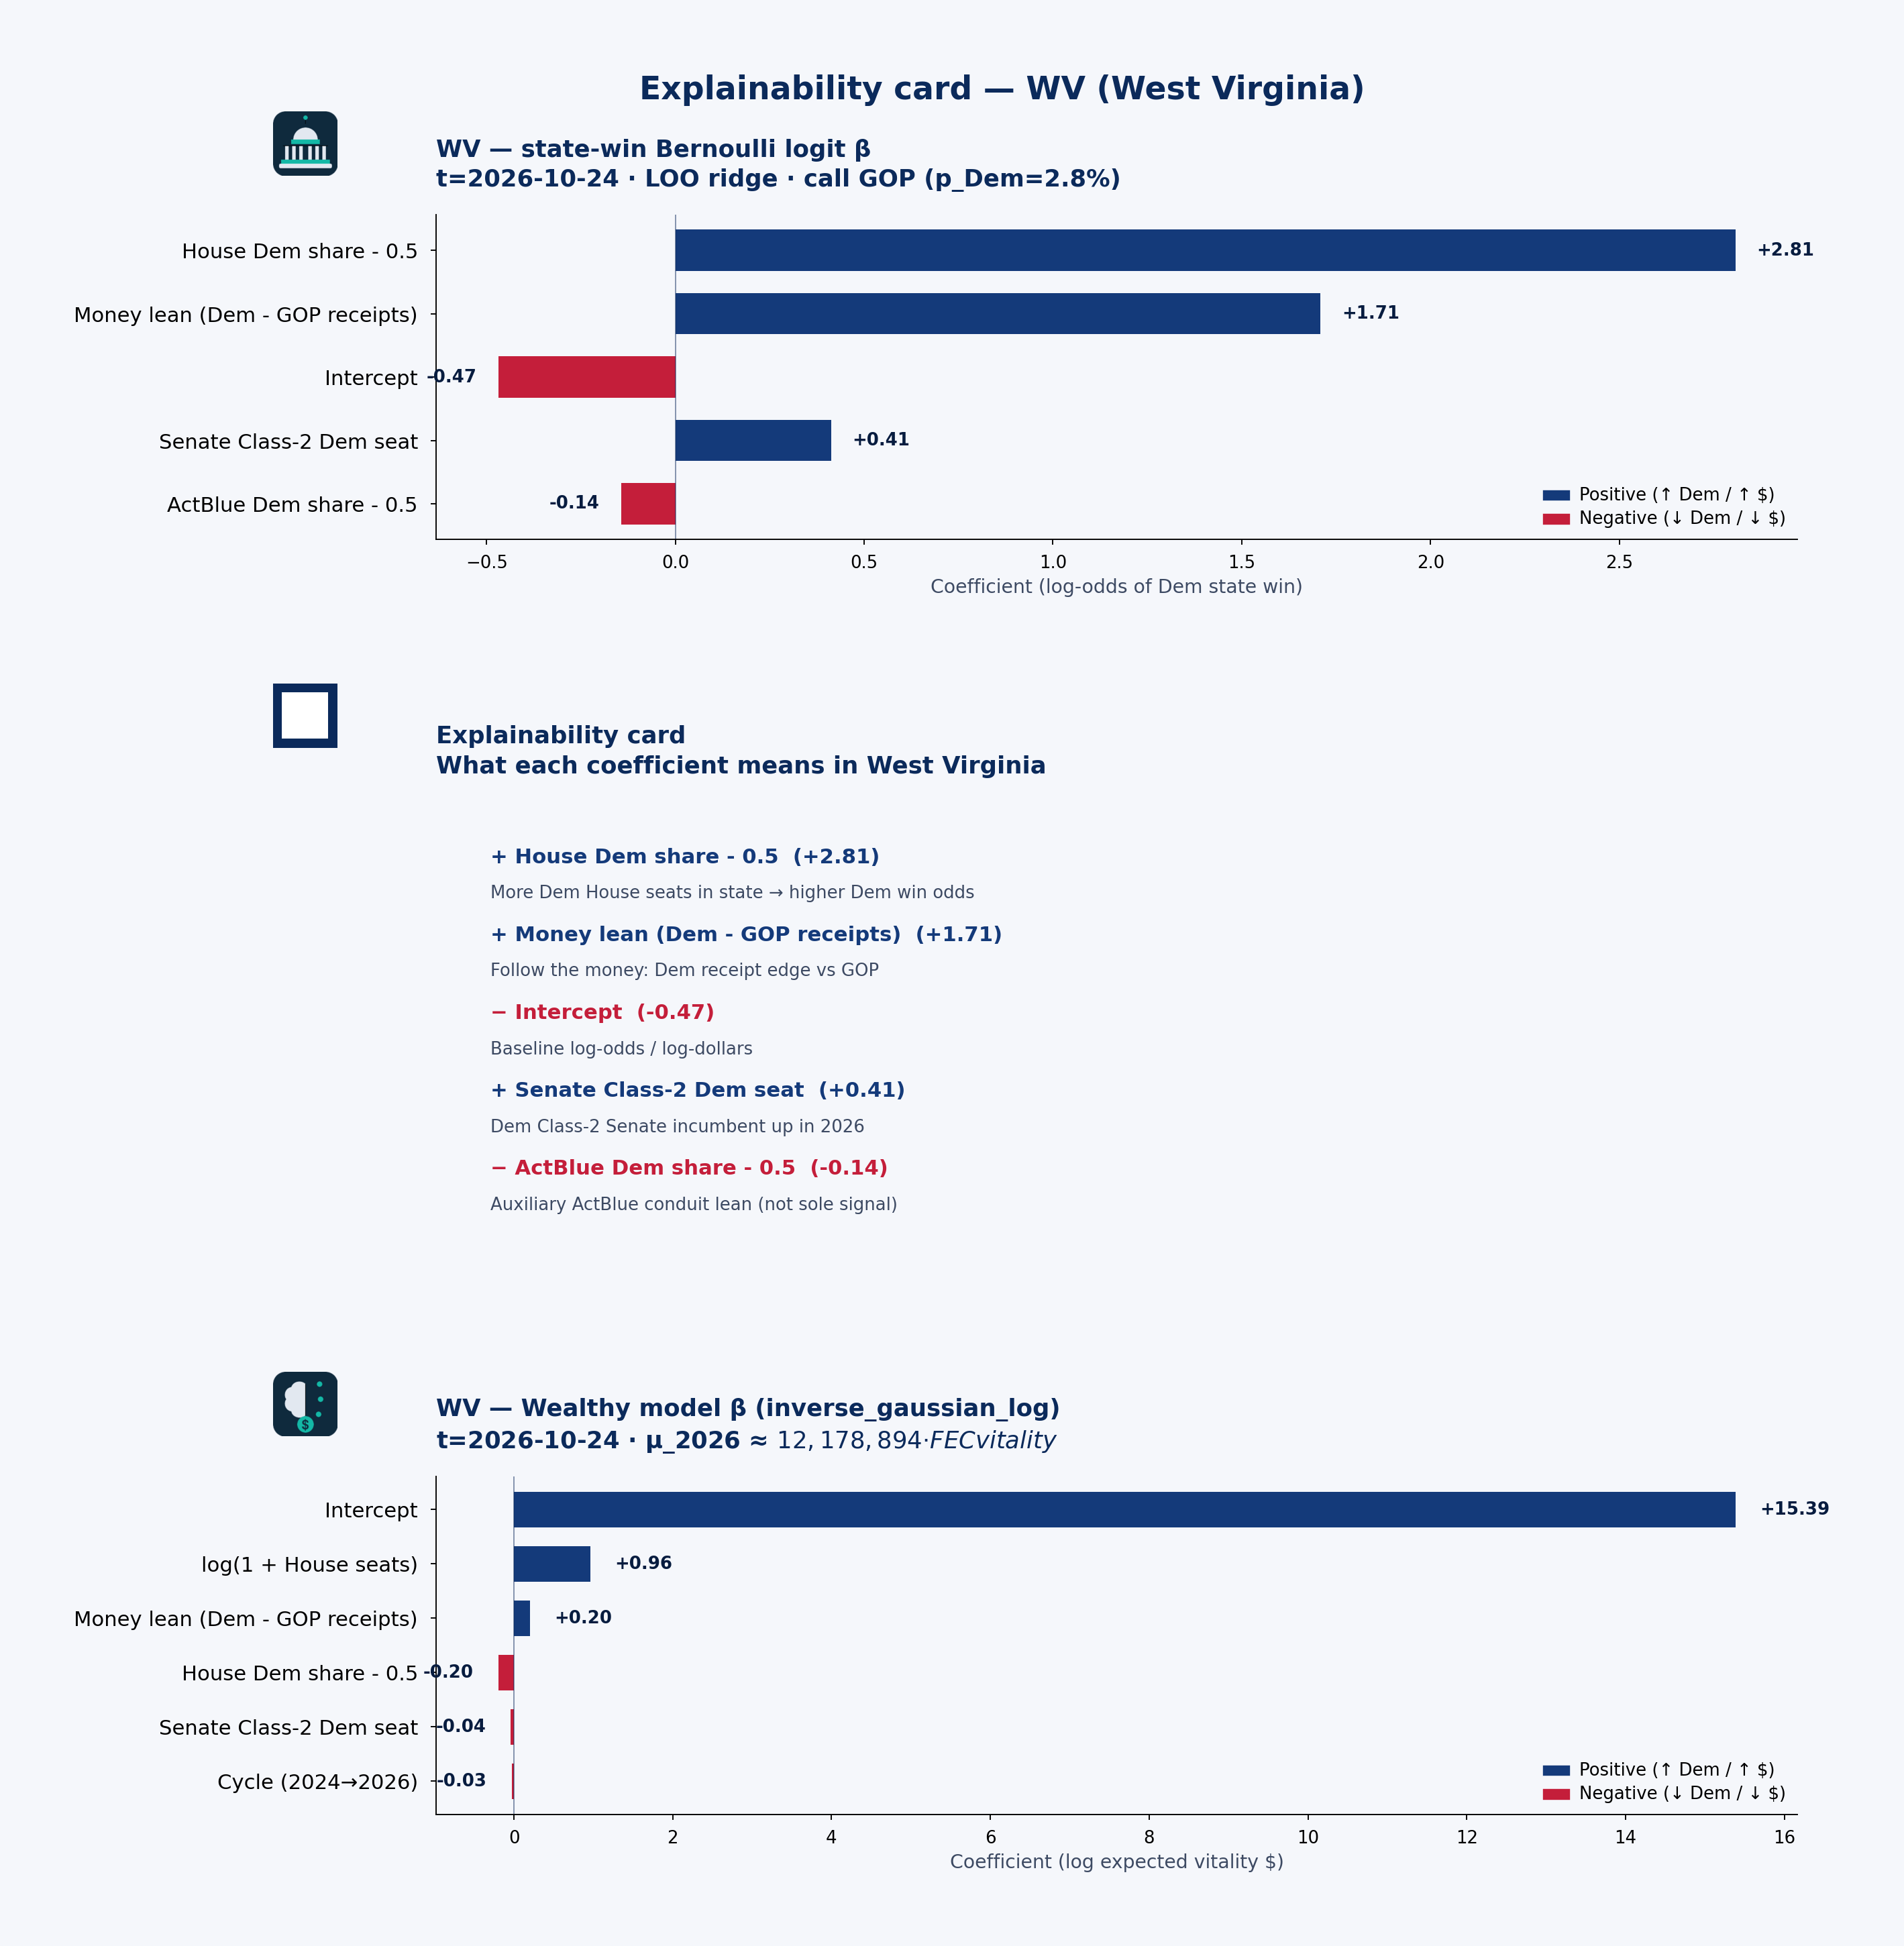 State explainability card · state-win LOO coefficient stability, plain language, and Wealthy model · WV · t=2026-10-24
Statewide call: GOP (p_Dem=3%) · 2026 money shape: PAC-heavy
Receipts by cycle (campaign-finance weball)
| Cycle | Candidate | Total receipts | Individual | PAC (other pol. cmte) |
|---|---|---|---|---|
| 2024 | CAPITO, SHELLEY MOORE | $1.00M | $315k | $573k |
| 2026 | CAPITO, SHELLEY MOORE | $5.45M | $2.89M | $2.05M |
| 2024 | JUSTICE, JAMES CONLEY II | $4.59M | $2.73M | $704k |
| 2026 | JUSTICE, JAMES CONLEY II | $87k | $46k | $39k |
| 2024 | MILLER, CAROL DEVINE | $1.75M | $582k | $1.14M |
| 2026 | MILLER, CAROL DEVINE | $2.04M | $548k | $1.45M |
| 2024 | MOORE, RILEY | $1.44M | $820k | $484k |
| 2026 | MOORE, RILEY | $1.62M | $555k | $678k |
PAC & individual money
PAC money was about $2.90M of $8.78M total receipts in 2024 and $4.22M of $9.19M in 2026. Direct committee→candidate 24K (non-memo) ran about $3.41M (2024) / $4.08M (2026). Itemized individual share from West Virginia: 50.6% (2024) / 43.9% (2026).
CAPITO, SHELLEY MOORE: Cycle-to-date weball receipts ~$5.45M, with PAC direct 24K $773k → $2.12M vs 2024. the public campaign-finance data feed by-size individual totals are not loaded in this 50-state snapshot.
Spotlight candidates
CAPITO, SHELLEY MOORE
- In 2024, $315k of $1.00M came from individuals; PAC (other pol. cmte) $573k.
- In 2026, $2.89M of $5.45M came from individuals; PAC (other pol. cmte) $2.05M.
JUSTICE, JAMES CONLEY II
- In 2024, $2.73M of $4.59M came from individuals; PAC (other pol. cmte) $704k.
- In 2026, $46k of $87k came from individuals; PAC (other pol. cmte) $39k.
MILLER, CAROL DEVINE
- In 2024, $582k of $1.75M came from individuals; PAC (other pol. cmte) $1.14M.
- In 2026, $548k of $2.04M came from individuals; PAC (other pol. cmte) $1.45M.
Short talking points — money & predicted voting
Open with the model set’s statewide call: GOP favored at about 3% Dem win probability on public campaign-finance + roster features — not a poll. Then the money shape: West Virginia federal candidates look PAC-heavy in 2026 weball (about $4.22M PAC / $4.04M individual of $9.19M total). Spotlight CAPITO, SHELLEY MOORE for one concrete receipt picture. Close civic: these are public contribution patterns and a transparent forecast model call — not evidence of wrongdoing, and not a substitute for Cook or election-night counts.
WY — Wyoming
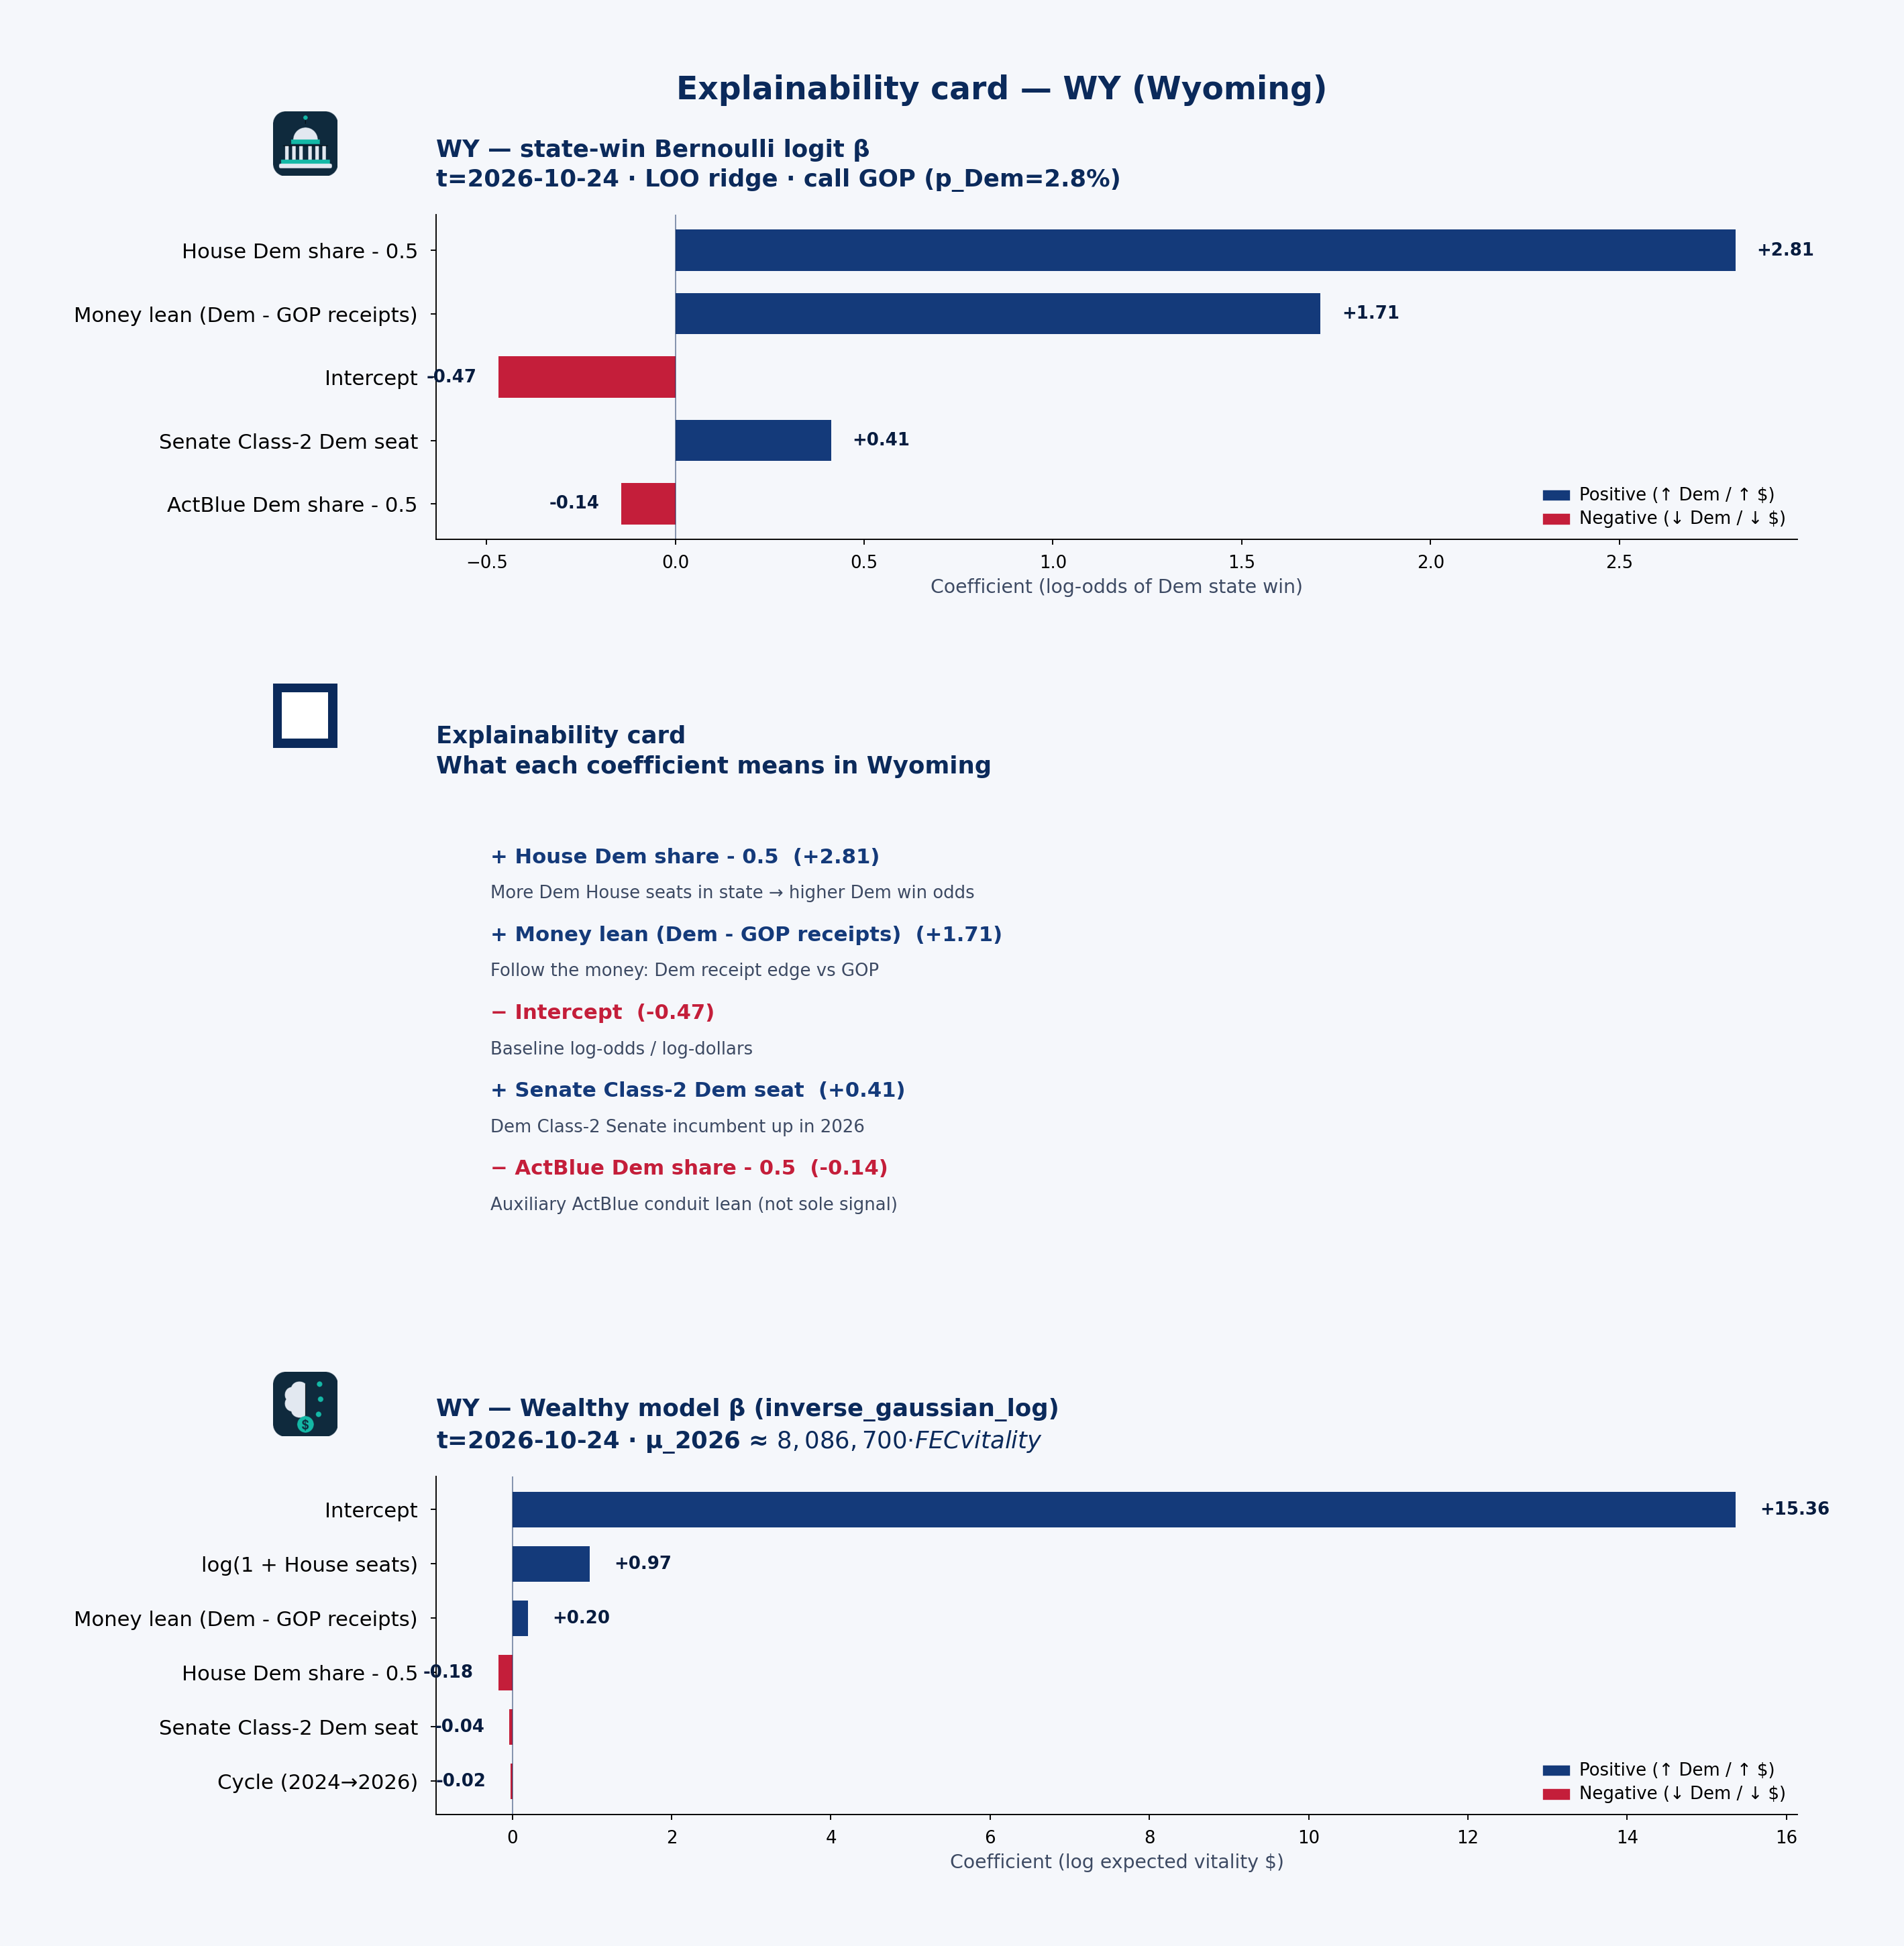 State explainability card · state-win LOO coefficient stability, plain language, and Wealthy model · WY · t=2026-10-24
Statewide call: GOP (p_Dem=3%) · 2026 money shape: balanced
Receipts by cycle (campaign-finance weball)
| Cycle | Candidate | Total receipts | Individual | PAC (other pol. cmte) |
|---|---|---|---|---|
| 2024 | BARRASSO, JOHN A | $7.76M | $3.65M | $2.73M |
| 2026 | BARRASSO, JOHN A | $1.84M | $519k | $428k |
| 2026 | HAGEMAN, HARRIET | $2.81M | $1.47M | $659k |
| 2024 | LUMMIS, CYNTHIA MARIE MRS. | $806k | $269k | $406k |
| 2026 | LUMMIS, CYNTHIA MARIE MRS. | $1.49M | $403k | $697k |
PAC & individual money
PAC money was about $3.13M of $8.57M total receipts in 2024 and $1.78M of $6.15M in 2026. Direct committee→candidate 24K (non-memo) ran about $3.34M (2024) / $1.71M (2026). Itemized individual share from Wyoming: 45.7% (2024) / 38.9% (2026).
BARRASSO, JOHN A: Cycle-to-date weball receipts ~$1.84M, with PAC direct 24K $2.96M → $432k vs 2024. the public campaign-finance data feed by-size individual totals are not loaded in this 50-state snapshot.
Spotlight candidates
BARRASSO, JOHN A
- In 2024, $3.65M of $7.76M came from individuals; PAC (other pol. cmte) $2.73M.
- In 2026, $519k of $1.84M came from individuals; PAC (other pol. cmte) $428k.
HAGEMAN, HARRIET
- In 2026, $1.47M of $2.81M came from individuals; PAC (other pol. cmte) $659k.
LUMMIS, CYNTHIA MARIE MRS.
- In 2024, $269k of $806k came from individuals; PAC (other pol. cmte) $406k.
- In 2026, $403k of $1.49M came from individuals; PAC (other pol. cmte) $697k.
Short talking points — money & predicted voting
Open with the model set’s statewide call: GOP favored at about 3% Dem win probability on public campaign-finance + roster features — not a poll. Then the money shape: Wyoming federal candidates look balanced in 2026 weball (about $1.78M PAC / $2.39M individual of $6.15M total). Spotlight BARRASSO, JOHN A for one concrete receipt picture. Close civic: these are public contribution patterns and a transparent forecast model call — not evidence of wrongdoing, and not a substitute for Cook or election-night counts.